TitanMachinery TITN full analysis,charts,indicators,moving averages,SMA,DMA,EMA,ADX,MACD,RSITitan Machinery TITN WideScreen charts, DMA,SMA,EMA technical analysis, forecast prediction, by indicators ADX,MACD,RSI,CCI USA stock exchange
operates under Consumer Services sector & deals in Other Specialty Stores
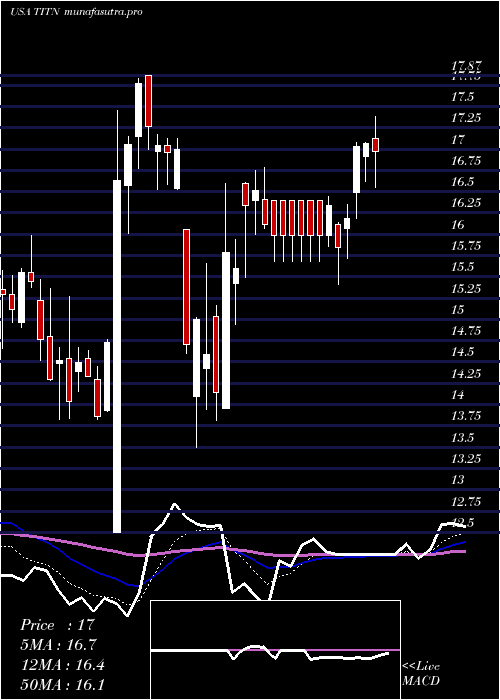
Daily price and charts and targets TitanMachinery Strong Daily Stock price targets for TitanMachinery TITN are 15.56 and 16.57 | Daily Target 1 | 15.37 | | Daily Target 2 | 15.74 | | Daily Target 3 | 16.376666666667 | | Daily Target 4 | 16.75 | | Daily Target 5 | 17.39 |
Daily price and volume Titan Machinery
| Date |
Closing |
Open |
Range |
Volume |
Thu 04 December 2025 |
16.12 (-2.72%) |
16.53 |
16.00 - 17.01 |
0.5752 times |
Wed 03 December 2025 |
16.57 (-2.13%) |
16.99 |
16.41 - 17.25 |
0.6851 times |
Tue 02 December 2025 |
16.93 (-0.06%) |
17.10 |
16.87 - 17.25 |
0.8235 times |
Mon 01 December 2025 |
16.94 (-8.53%) |
17.43 |
16.51 - 18.03 |
2.179 times |
Fri 28 November 2025 |
18.52 (-0.96%) |
18.56 |
18.08 - 18.99 |
0.7849 times |
Wed 26 November 2025 |
18.70 (-4.05%) |
19.24 |
17.96 - 19.34 |
1.6115 times |
Tue 25 November 2025 |
19.49 (18.34%) |
17.01 |
16.93 - 20.39 |
2.0514 times |
Mon 24 November 2025 |
16.47 (4.57%) |
15.75 |
15.57 - 16.57 |
0.4457 times |
Fri 21 November 2025 |
15.75 (5.42%) |
14.96 |
14.94 - 15.96 |
0.4771 times |
Thu 20 November 2025 |
14.94 (-1.19%) |
15.35 |
14.93 - 15.48 |
0.3669 times |
Wed 19 November 2025 |
15.12 (-1.37%) |
15.34 |
15.03 - 15.54 |
0.3477 times |
Weekly price and charts TitanMachinery Strong weekly Stock price targets for TitanMachinery TITN are 15.05 and 17.08 | Weekly Target 1 | 14.69 | | Weekly Target 2 | 15.4 | | Weekly Target 3 | 16.716666666667 | | Weekly Target 4 | 17.43 | | Weekly Target 5 | 18.75 |
Weekly price and volumes for Titan Machinery
| Date |
Closing |
Open |
Range |
Volume |
Thu 04 December 2025 |
16.12 (-12.96%) |
17.43 |
16.00 - 18.03 |
1.391 times |
Fri 28 November 2025 |
18.52 (17.59%) |
15.75 |
15.57 - 20.39 |
1.5969 times |
Fri 21 November 2025 |
15.75 (-0.32%) |
15.76 |
14.93 - 16.09 |
0.6499 times |
Fri 14 November 2025 |
15.80 (-0.06%) |
15.94 |
15.67 - 16.78 |
0.6876 times |
Fri 07 November 2025 |
15.81 (-3.6%) |
16.46 |
15.53 - 16.82 |
0.7581 times |
Fri 31 October 2025 |
16.40 (0%) |
16.37 |
16.14 - 16.46 |
0.176 times |
Fri 31 October 2025 |
16.40 (2.89%) |
16.11 |
16.11 - 17.06 |
1.2354 times |
Fri 24 October 2025 |
15.94 (3.84%) |
15.51 |
15.30 - 15.99 |
0.9394 times |
Fri 17 October 2025 |
15.35 (0.46%) |
15.46 |
15.15 - 16.19 |
1.1784 times |
Fri 10 October 2025 |
15.28 (-7.79%) |
16.62 |
15.24 - 16.83 |
1.3874 times |
Fri 03 October 2025 |
16.57 (-2.93%) |
17.20 |
15.74 - 17.20 |
1.287 times |
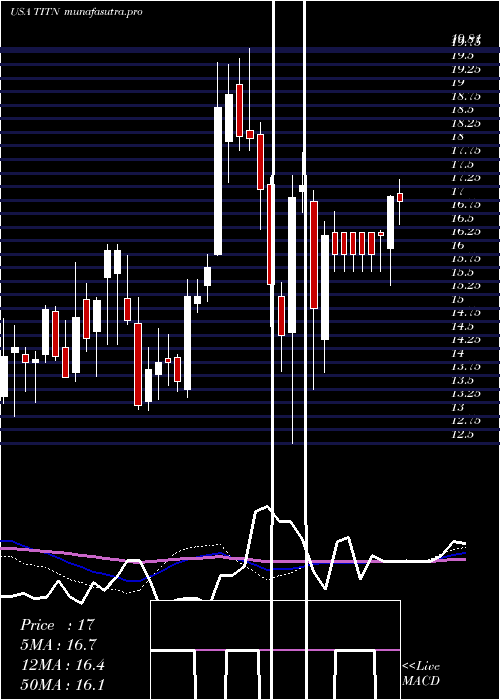
Monthly price and charts TitanMachinery Strong monthly Stock price targets for TitanMachinery TITN are 15.05 and 17.08 | Monthly Target 1 | 14.69 | | Monthly Target 2 | 15.4 | | Monthly Target 3 | 16.716666666667 | | Monthly Target 4 | 17.43 | | Monthly Target 5 | 18.75 |
Monthly price and volumes Titan Machinery
| Date |
Closing |
Open |
Range |
Volume |
Thu 04 December 2025 |
16.12 (-12.96%) |
17.43 |
16.00 - 18.03 |
0.2983 times |
Fri 28 November 2025 |
18.52 (12.93%) |
16.46 |
14.93 - 20.39 |
0.7919 times |
Fri 31 October 2025 |
16.40 (-2.03%) |
16.76 |
15.15 - 17.06 |
1.2297 times |
Tue 30 September 2025 |
16.74 (-16.3%) |
19.70 |
16.60 - 21.25 |
1.0973 times |
Fri 29 August 2025 |
20.00 (3.52%) |
18.84 |
18.31 - 21.57 |
0.8071 times |
Thu 31 July 2025 |
19.32 (-2.47%) |
19.65 |
19.06 - 21.75 |
0.8418 times |
Mon 30 June 2025 |
19.81 (6.05%) |
18.75 |
18.29 - 20.30 |
0.902 times |
Fri 30 May 2025 |
18.68 (12.6%) |
16.60 |
16.49 - 23.41 |
1.2711 times |
Wed 30 April 2025 |
16.59 (-2.64%) |
17.04 |
13.50 - 17.38 |
1.2503 times |
Mon 31 March 2025 |
17.04 (-0.87%) |
17.28 |
12.50 - 17.87 |
1.5105 times |
Fri 28 February 2025 |
17.19 (-8.17%) |
18.09 |
16.45 - 19.81 |
1.273 times |

DMA SMA EMA moving averages of Titan Machinery TITN
DMA (daily moving average) of Titan Machinery TITN
| DMA period | DMA value | | 5 day DMA | 17.02 | | 12 day DMA | 16.74 | | 20 day DMA | 16.48 | | 35 day DMA | 16.29 | | 50 day DMA | 16.25 | | 100 day DMA | 17.95 | | 150 day DMA | 18.52 | | 200 day DMA | 17.9 | EMA (exponential moving average) of Titan Machinery TITN
| EMA period | EMA current | EMA prev | EMA prev2 | | 5 day EMA | 16.77 | 17.1 | 17.36 | | 12 day EMA | 16.81 | 16.93 | 17 | | 20 day EMA | 16.67 | 16.73 | 16.75 | | 35 day EMA | 16.55 | 16.58 | 16.58 | | 50 day EMA | 16.48 | 16.49 | 16.49 |
SMA (simple moving average) of Titan Machinery TITN
| SMA period | SMA current | SMA prev | SMA prev2 | | 5 day SMA | 17.02 | 17.53 | 18.12 | | 12 day SMA | 16.74 | 16.68 | 16.61 | | 20 day SMA | 16.48 | 16.51 | 16.5 | | 35 day SMA | 16.29 | 16.27 | 16.24 | | 50 day SMA | 16.25 | 16.28 | 16.3 | | 100 day SMA | 17.95 | 17.98 | 18.01 | | 150 day SMA | 18.52 | 18.52 | 18.53 | | 200 day SMA | 17.9 | 17.92 | 17.93 |
|
|
