MillicomInternational TIGO full analysis,charts,indicators,moving averages,SMA,DMA,EMA,ADX,MACD,RSIMillicom International TIGO WideScreen charts, DMA,SMA,EMA technical analysis, forecast prediction, by indicators ADX,MACD,RSI,CCI USA stock exchange
operates under Public Utilities sector & deals in Telecommunications Equipment
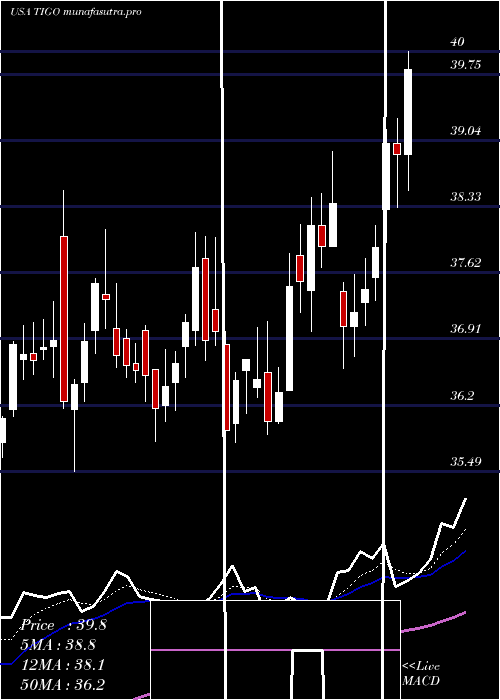
Daily price and charts and targets MillicomInternational Strong Daily Stock price targets for MillicomInternational TIGO are 45.73 and 46.71 | Daily Target 1 | 45.5 | | Daily Target 2 | 45.96 | | Daily Target 3 | 46.483333333333 | | Daily Target 4 | 46.94 | | Daily Target 5 | 47.46 |
Daily price and volume Millicom International
| Date |
Closing |
Open |
Range |
Volume |
Tue 21 October 2025 |
46.41 (-1.59%) |
47.00 |
46.03 - 47.01 |
0.7755 times |
Mon 20 October 2025 |
47.16 (-0.17%) |
47.33 |
46.61 - 47.45 |
0.9324 times |
Fri 17 October 2025 |
47.24 (1.7%) |
46.23 |
46.05 - 47.36 |
1.1673 times |
Thu 16 October 2025 |
46.45 (-0.66%) |
46.93 |
46.10 - 47.00 |
0.8413 times |
Wed 15 October 2025 |
46.76 (1.39%) |
46.04 |
45.76 - 47.35 |
0.9938 times |
Tue 14 October 2025 |
46.12 (-2.88%) |
47.41 |
45.35 - 47.52 |
1.0408 times |
Mon 13 October 2025 |
47.49 (-0.27%) |
47.74 |
47.40 - 48.40 |
0.899 times |
Fri 10 October 2025 |
47.62 (0.59%) |
47.34 |
46.98 - 48.12 |
0.9601 times |
Thu 09 October 2025 |
47.34 (-0.63%) |
47.60 |
47.16 - 47.84 |
1.0744 times |
Wed 08 October 2025 |
47.64 (-1.91%) |
46.97 |
46.79 - 48.16 |
1.3154 times |
Tue 07 October 2025 |
48.57 (0.21%) |
48.35 |
47.75 - 48.70 |
1.3196 times |
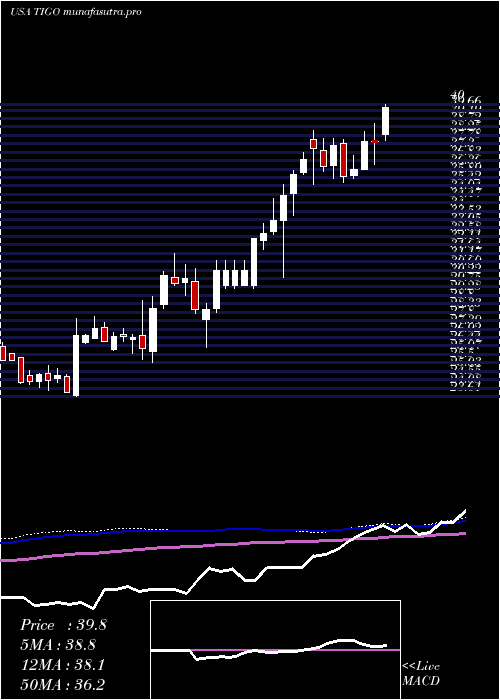
Weekly price and charts MillicomInternational Strong weekly Stock price targets for MillicomInternational TIGO are 45.51 and 46.93 | Weekly Target 1 | 45.21 | | Weekly Target 2 | 45.81 | | Weekly Target 3 | 46.63 | | Weekly Target 4 | 47.23 | | Weekly Target 5 | 48.05 |
Weekly price and volumes for Millicom International
| Date |
Closing |
Open |
Range |
Volume |
Tue 21 October 2025 |
46.41 (-1.76%) |
47.33 |
46.03 - 47.45 |
0.2585 times |
Fri 17 October 2025 |
47.24 (-0.8%) |
47.74 |
45.35 - 48.40 |
0.7479 times |
Fri 10 October 2025 |
47.62 (-1.1%) |
48.15 |
46.79 - 48.78 |
0.8912 times |
Fri 03 October 2025 |
48.15 (-0.17%) |
48.57 |
46.67 - 48.74 |
0.7431 times |
Fri 26 September 2025 |
48.23 (-2.92%) |
49.75 |
46.92 - 50.33 |
1.0739 times |
Fri 19 September 2025 |
49.68 (4.52%) |
48.40 |
47.27 - 49.81 |
1.8101 times |
Fri 12 September 2025 |
47.53 (0.81%) |
47.16 |
45.48 - 48.45 |
1.4809 times |
Fri 05 September 2025 |
47.15 (-2.4%) |
48.08 |
46.97 - 50.78 |
1.5006 times |
Fri 29 August 2025 |
48.31 (0%) |
48.18 |
47.80 - 48.42 |
0.202 times |
Fri 29 August 2025 |
48.31 (2.37%) |
47.25 |
45.93 - 48.92 |
1.2918 times |
Fri 22 August 2025 |
47.19 (5.64%) |
44.80 |
44.06 - 47.26 |
1.4875 times |
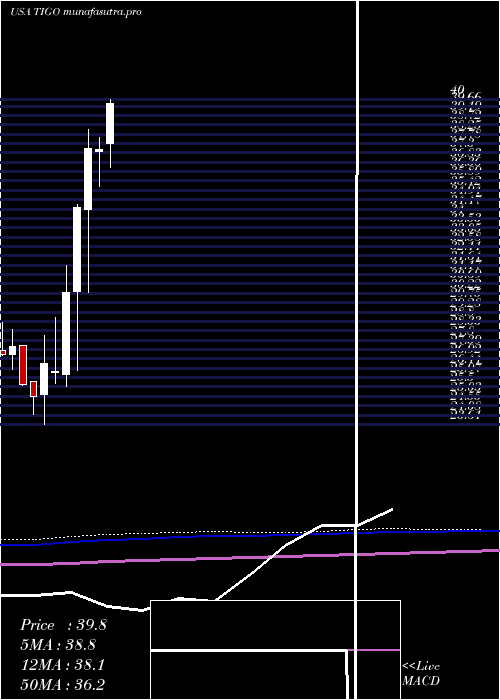
Monthly price and charts MillicomInternational Strong monthly Stock price targets for MillicomInternational TIGO are 44.17 and 47.6 | Monthly Target 1 | 43.42 | | Monthly Target 2 | 44.91 | | Monthly Target 3 | 46.846666666667 | | Monthly Target 4 | 48.34 | | Monthly Target 5 | 50.28 |
Monthly price and volumes Millicom International
| Date |
Closing |
Open |
Range |
Volume |
Tue 21 October 2025 |
46.41 (-4.39%) |
48.61 |
45.35 - 48.78 |
0.4972 times |
Tue 30 September 2025 |
48.54 (0.48%) |
48.08 |
45.48 - 50.78 |
1.347 times |
Fri 29 August 2025 |
48.31 (20.32%) |
40.31 |
39.01 - 48.92 |
1.3783 times |
Thu 31 July 2025 |
40.15 (7.15%) |
37.80 |
36.59 - 43.04 |
1.3804 times |
Mon 30 June 2025 |
37.47 (-0.11%) |
37.39 |
35.62 - 38.09 |
1.1241 times |
Fri 30 May 2025 |
37.51 (8.6%) |
34.44 |
30.26 - 38.50 |
0.832 times |
Wed 30 April 2025 |
34.54 (14.11%) |
30.32 |
26.35 - 34.68 |
1.2053 times |
Mon 31 March 2025 |
30.27 (15.18%) |
26.12 |
25.50 - 31.63 |
1.3644 times |
Fri 28 February 2025 |
26.28 (-1.57%) |
26.23 |
25.66 - 28.98 |
0.4578 times |
Fri 31 January 2025 |
26.70 (6.76%) |
25.12 |
23.61 - 28.09 |
0.4134 times |
Tue 31 December 2024 |
25.01 (-2.34%) |
25.77 |
24.09 - 25.77 |
0.1172 times |
DMA SMA EMA moving averages of Millicom International TIGO
DMA (daily moving average) of Millicom International TIGO
| DMA period | DMA value | | 5 day DMA | 46.8 | | 12 day DMA | 47.27 | | 20 day DMA | 47.54 | | 35 day DMA | 47.81 | | 50 day DMA | 47.45 | | 100 day DMA | 42.99 | | 150 day DMA | 39.44 | | 200 day DMA | 36.34 | EMA (exponential moving average) of Millicom International TIGO
| EMA period | EMA current | EMA prev | EMA prev2 | | 5 day EMA | 46.82 | 47.03 | 46.97 | | 12 day EMA | 47.16 | 47.3 | 47.32 | | 20 day EMA | 47.33 | 47.43 | 47.46 | | 35 day EMA | 47.15 | 47.19 | 47.19 | | 50 day EMA | 46.96 | 46.98 | 46.97 |
SMA (simple moving average) of Millicom International TIGO
| SMA period | SMA current | SMA prev | SMA prev2 | | 5 day SMA | 46.8 | 46.75 | 46.81 | | 12 day SMA | 47.27 | 47.42 | 47.48 | | 20 day SMA | 47.54 | 47.74 | 47.81 | | 35 day SMA | 47.81 | 47.9 | 47.93 | | 50 day SMA | 47.45 | 47.39 | 47.3 | | 100 day SMA | 42.99 | 42.89 | 42.78 | | 150 day SMA | 39.44 | 39.34 | 39.22 | | 200 day SMA | 36.34 | 36.23 | 36.12 |
|
|
