GenthermInc THRM full analysis,charts,indicators,moving averages,SMA,DMA,EMA,ADX,MACD,RSIGentherm Inc THRM WideScreen charts, DMA,SMA,EMA technical analysis, forecast prediction, by indicators ADX,MACD,RSI,CCI USA stock exchange
operates under Capital Goods sector & deals in Auto Parts O E M
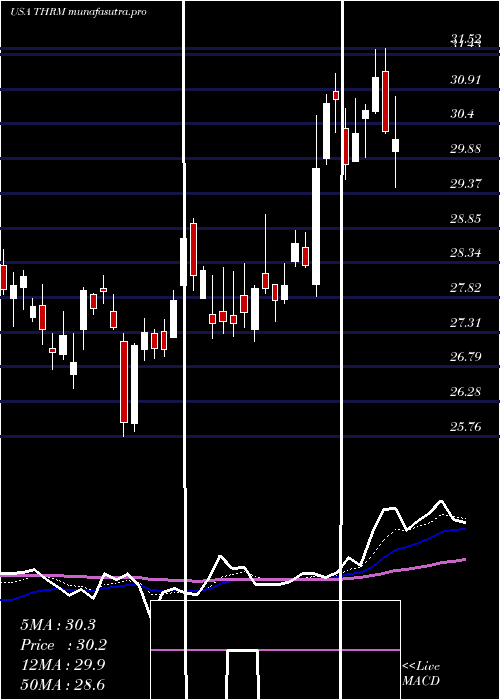
Daily price and charts and targets GenthermInc Strong Daily Stock price targets for GenthermInc THRM are 36.67 and 37.49 | Daily Target 1 | 35.99 | | Daily Target 2 | 36.52 | | Daily Target 3 | 36.806666666667 | | Daily Target 4 | 37.34 | | Daily Target 5 | 37.63 |
Daily price and volume Gentherm Inc
| Date |
Closing |
Open |
Range |
Volume |
Thu 04 December 2025 |
37.06 (0.9%) |
36.59 |
36.27 - 37.09 |
0.756 times |
Wed 03 December 2025 |
36.73 (2.86%) |
35.98 |
35.98 - 37.42 |
1.256 times |
Tue 02 December 2025 |
35.71 (-1.27%) |
36.33 |
35.40 - 36.54 |
1.6786 times |
Mon 01 December 2025 |
36.17 (1.4%) |
35.43 |
35.17 - 36.26 |
0.7049 times |
Fri 28 November 2025 |
35.67 (0%) |
35.96 |
35.45 - 36.27 |
0.3631 times |
Wed 26 November 2025 |
35.67 (-1.08%) |
35.79 |
35.62 - 36.62 |
1.5327 times |
Tue 25 November 2025 |
36.06 (2.36%) |
35.23 |
35.05 - 36.53 |
0.8829 times |
Mon 24 November 2025 |
35.23 (0.69%) |
34.87 |
34.63 - 35.53 |
1.1037 times |
Fri 21 November 2025 |
34.99 (7.04%) |
32.92 |
32.91 - 35.03 |
1.0813 times |
Thu 20 November 2025 |
32.69 (-3.48%) |
34.30 |
32.60 - 34.37 |
0.6409 times |
Wed 19 November 2025 |
33.87 (-1.4%) |
34.35 |
33.76 - 34.63 |
0.6007 times |
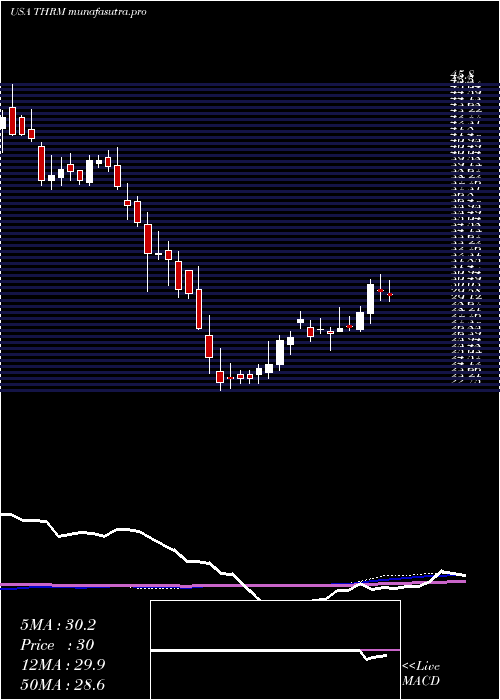
Weekly price and charts GenthermInc Strong weekly Stock price targets for GenthermInc THRM are 36.12 and 38.37 | Weekly Target 1 | 34.3 | | Weekly Target 2 | 35.68 | | Weekly Target 3 | 36.55 | | Weekly Target 4 | 37.93 | | Weekly Target 5 | 38.8 |
Weekly price and volumes for Gentherm Inc
| Date |
Closing |
Open |
Range |
Volume |
Thu 04 December 2025 |
37.06 (3.9%) |
35.43 |
35.17 - 37.42 |
1.0652 times |
Fri 28 November 2025 |
35.67 (1.94%) |
34.87 |
34.63 - 36.62 |
0.9409 times |
Fri 21 November 2025 |
34.99 (-2.1%) |
35.48 |
32.60 - 35.92 |
0.851 times |
Fri 14 November 2025 |
35.74 (-1.16%) |
36.37 |
35.50 - 38.55 |
1.0063 times |
Fri 07 November 2025 |
36.16 (-1.74%) |
36.99 |
35.38 - 37.40 |
0.7159 times |
Fri 31 October 2025 |
36.80 (0%) |
36.53 |
36.01 - 37.10 |
0.2914 times |
Fri 31 October 2025 |
36.80 (-1.34%) |
37.35 |
36.01 - 38.19 |
1.4439 times |
Fri 24 October 2025 |
37.30 (9.29%) |
34.25 |
34.03 - 38.11 |
1.5266 times |
Fri 17 October 2025 |
34.13 (1.94%) |
33.86 |
32.00 - 34.65 |
0.985 times |
Fri 10 October 2025 |
33.48 (-6.58%) |
35.87 |
33.40 - 36.09 |
1.1738 times |
Fri 03 October 2025 |
35.84 (1.76%) |
35.40 |
33.24 - 35.87 |
1.1252 times |
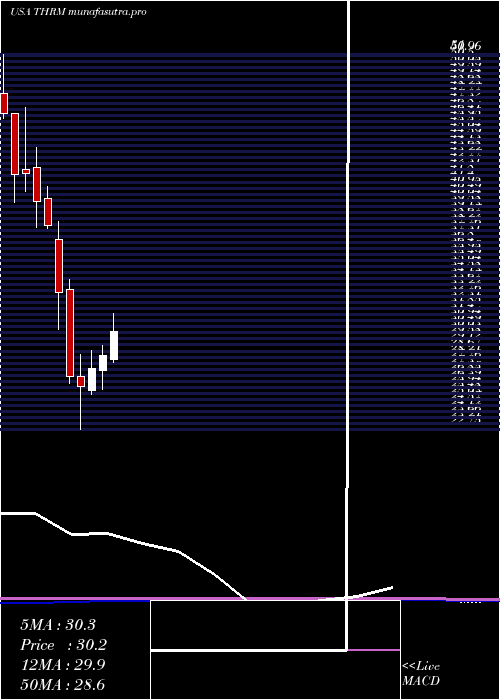
Monthly price and charts GenthermInc Strong monthly Stock price targets for GenthermInc THRM are 36.12 and 38.37 | Monthly Target 1 | 34.3 | | Monthly Target 2 | 35.68 | | Monthly Target 3 | 36.55 | | Monthly Target 4 | 37.93 | | Monthly Target 5 | 38.8 |
Monthly price and volumes Gentherm Inc
| Date |
Closing |
Open |
Range |
Volume |
Thu 04 December 2025 |
37.06 (3.9%) |
35.43 |
35.17 - 37.42 |
0.1693 times |
Fri 28 November 2025 |
35.67 (-3.07%) |
36.99 |
32.60 - 38.55 |
0.5587 times |
Fri 31 October 2025 |
36.80 (8.04%) |
33.84 |
32.00 - 38.19 |
0.9757 times |
Tue 30 September 2025 |
34.06 (-7.37%) |
36.35 |
33.24 - 36.89 |
0.8006 times |
Fri 29 August 2025 |
36.77 (14.76%) |
31.65 |
30.99 - 37.26 |
0.9027 times |
Thu 31 July 2025 |
32.04 (13.26%) |
28.02 |
27.83 - 34.75 |
1.2037 times |
Mon 30 June 2025 |
28.29 (3.36%) |
27.17 |
25.76 - 29.05 |
1.0255 times |
Fri 30 May 2025 |
27.37 (5.23%) |
25.71 |
25.42 - 28.73 |
1.0604 times |
Wed 30 April 2025 |
26.01 (-2.73%) |
26.77 |
22.75 - 28.42 |
2.2234 times |
Mon 31 March 2025 |
26.74 (-19.17%) |
33.28 |
26.21 - 34.02 |
1.08 times |
Fri 28 February 2025 |
33.08 (-13.29%) |
37.10 |
30.25 - 38.40 |
1.1075 times |
DMA SMA EMA moving averages of Gentherm Inc THRM
DMA (daily moving average) of Gentherm Inc THRM
| DMA period | DMA value | | 5 day DMA | 36.27 | | 12 day DMA | 35.35 | | 20 day DMA | 35.74 | | 35 day DMA | 35.9 | | 50 day DMA | 35.5 | | 100 day DMA | 35.03 | | 150 day DMA | 32.69 | | 200 day DMA | 31.63 | EMA (exponential moving average) of Gentherm Inc THRM
| EMA period | EMA current | EMA prev | EMA prev2 | | 5 day EMA | 36.38 | 36.04 | 35.69 | | 12 day EMA | 35.93 | 35.73 | 35.55 | | 20 day EMA | 35.83 | 35.7 | 35.59 | | 35 day EMA | 35.61 | 35.52 | 35.45 | | 50 day EMA | 35.56 | 35.5 | 35.45 |
SMA (simple moving average) of Gentherm Inc THRM
| SMA period | SMA current | SMA prev | SMA prev2 | | 5 day SMA | 36.27 | 35.99 | 35.86 | | 12 day SMA | 35.35 | 35.15 | 35.07 | | 20 day SMA | 35.74 | 35.74 | 35.74 | | 35 day SMA | 35.9 | 35.82 | 35.74 | | 50 day SMA | 35.5 | 35.46 | 35.42 | | 100 day SMA | 35.03 | 34.96 | 34.89 | | 150 day SMA | 32.69 | 32.62 | 32.55 | | 200 day SMA | 31.63 | 31.62 | 31.62 |
|
|
