TecnoglassInc TGLS full analysis,charts,indicators,moving averages,SMA,DMA,EMA,ADX,MACD,RSITecnoglass Inc TGLS WideScreen charts, DMA,SMA,EMA technical analysis, forecast prediction, by indicators ADX,MACD,RSI,CCI USA stock exchange
operates under Consumer Durables sector & deals in Electronic Components
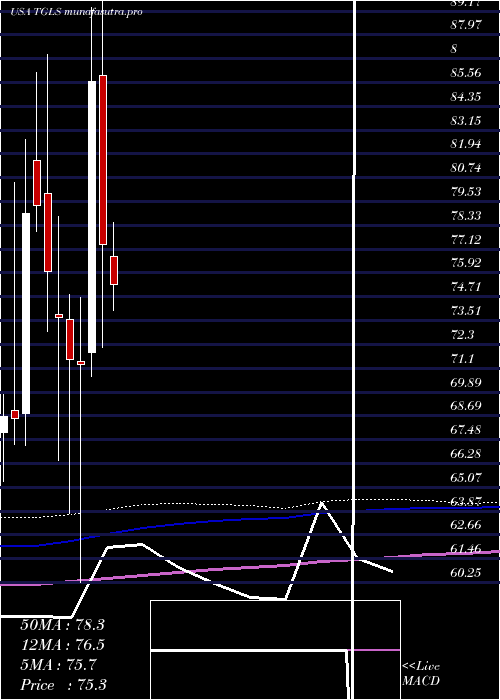
Daily price and charts and targets TecnoglassInc Strong Daily Stock price targets for TecnoglassInc TGLS are 50.99 and 51.96 | Daily Target 1 | 50.22 | | Daily Target 2 | 50.78 | | Daily Target 3 | 51.19 | | Daily Target 4 | 51.75 | | Daily Target 5 | 52.16 |
Daily price and volume Tecnoglass Inc
| Date |
Closing |
Open |
Range |
Volume |
Thu 04 December 2025 |
51.34 (0.88%) |
50.66 |
50.63 - 51.60 |
0.7123 times |
Wed 03 December 2025 |
50.89 (1.74%) |
49.92 |
49.92 - 51.12 |
0.6092 times |
Tue 02 December 2025 |
50.02 (-0.46%) |
50.33 |
48.53 - 51.01 |
1.1455 times |
Mon 01 December 2025 |
50.25 (0.94%) |
49.13 |
49.03 - 50.61 |
1.197 times |
Fri 28 November 2025 |
49.78 (1.43%) |
49.70 |
49.31 - 50.09 |
0.6044 times |
Wed 26 November 2025 |
49.08 (1.51%) |
47.84 |
47.84 - 49.68 |
1.2916 times |
Tue 25 November 2025 |
48.35 (3.89%) |
46.98 |
46.69 - 48.59 |
1.1319 times |
Mon 24 November 2025 |
46.54 (-1.59%) |
46.75 |
46.41 - 47.68 |
1.1777 times |
Fri 21 November 2025 |
47.29 (3.01%) |
46.09 |
46.09 - 48.31 |
1.1499 times |
Thu 20 November 2025 |
45.91 (-0.8%) |
46.89 |
45.65 - 47.54 |
0.9805 times |
Wed 19 November 2025 |
46.28 (1.56%) |
45.90 |
45.56 - 46.60 |
0.8013 times |
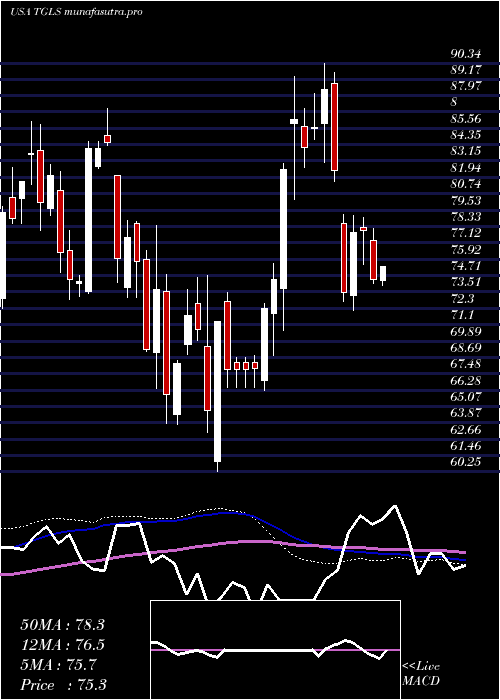
Weekly price and charts TecnoglassInc Strong weekly Stock price targets for TecnoglassInc TGLS are 49.94 and 53.01 | Weekly Target 1 | 47.42 | | Weekly Target 2 | 49.38 | | Weekly Target 3 | 50.49 | | Weekly Target 4 | 52.45 | | Weekly Target 5 | 53.56 |
Weekly price and volumes for Tecnoglass Inc
| Date |
Closing |
Open |
Range |
Volume |
Thu 04 December 2025 |
51.34 (3.13%) |
49.13 |
48.53 - 51.60 |
1.035 times |
Fri 28 November 2025 |
49.78 (5.27%) |
46.75 |
46.41 - 50.09 |
1.1879 times |
Fri 21 November 2025 |
47.29 (5.23%) |
44.87 |
44.26 - 48.31 |
1.4619 times |
Fri 14 November 2025 |
44.94 (-9.63%) |
50.38 |
44.51 - 50.43 |
1.9845 times |
Fri 07 November 2025 |
49.73 (-16.6%) |
58.00 |
49.38 - 58.09 |
1.3275 times |
Fri 31 October 2025 |
59.63 (0%) |
58.52 |
58.21 - 59.94 |
0.1369 times |
Fri 31 October 2025 |
59.63 (-0.62%) |
60.26 |
58.21 - 61.34 |
0.6927 times |
Fri 24 October 2025 |
60.00 (-4.15%) |
62.90 |
57.93 - 63.46 |
1.2188 times |
Fri 17 October 2025 |
62.60 (-1.82%) |
62.95 |
61.72 - 65.33 |
0.6977 times |
Tue 07 October 2025 |
63.76 (-3.67%) |
66.60 |
63.65 - 67.48 |
0.2571 times |
Fri 03 October 2025 |
66.19 (-2.43%) |
68.31 |
65.35 - 68.36 |
0.9487 times |
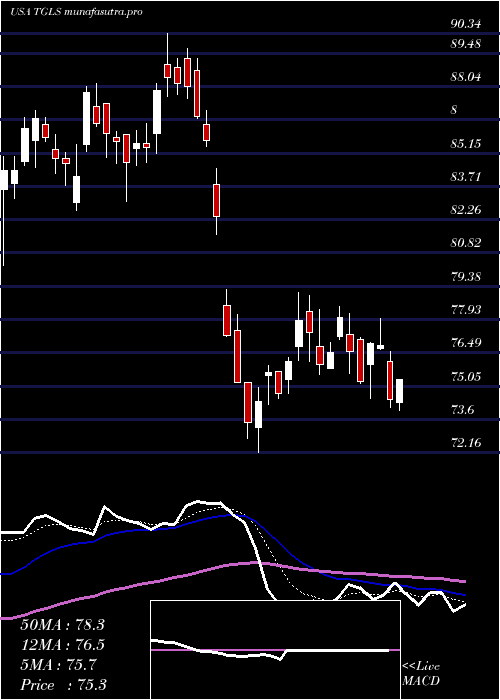
Monthly price and charts TecnoglassInc Strong monthly Stock price targets for TecnoglassInc TGLS are 49.94 and 53.01 | Monthly Target 1 | 47.42 | | Monthly Target 2 | 49.38 | | Monthly Target 3 | 50.49 | | Monthly Target 4 | 52.45 | | Monthly Target 5 | 53.56 |
Monthly price and volumes Tecnoglass Inc
| Date |
Closing |
Open |
Range |
Volume |
Thu 04 December 2025 |
51.34 (3.13%) |
49.13 |
48.53 - 51.60 |
0.2402 times |
Fri 28 November 2025 |
49.78 (-16.52%) |
58.00 |
44.26 - 58.09 |
1.3838 times |
Fri 31 October 2025 |
59.63 (-10.88%) |
66.76 |
57.93 - 67.57 |
0.7938 times |
Tue 30 September 2025 |
66.91 (-7.81%) |
71.15 |
65.11 - 73.95 |
0.9591 times |
Fri 29 August 2025 |
72.58 (-6.98%) |
76.76 |
67.68 - 83.32 |
1.403 times |
Thu 31 July 2025 |
78.03 (0.87%) |
76.74 |
72.75 - 79.90 |
0.8127 times |
Mon 30 June 2025 |
77.36 (-9.66%) |
85.93 |
72.16 - 90.34 |
0.8637 times |
Fri 30 May 2025 |
85.63 (20.15%) |
71.89 |
70.66 - 89.36 |
1.263 times |
Wed 30 April 2025 |
71.27 (-0.39%) |
71.46 |
60.25 - 74.68 |
0.889 times |
Mon 31 March 2025 |
71.55 (-2.86%) |
73.56 |
63.72 - 74.82 |
1.3916 times |
Fri 28 February 2025 |
73.66 (-3.08%) |
73.80 |
66.41 - 78.78 |
0.7818 times |
DMA SMA EMA moving averages of Tecnoglass Inc TGLS
DMA (daily moving average) of Tecnoglass Inc TGLS
| DMA period | DMA value | | 5 day DMA | 50.46 | | 12 day DMA | 48.44 | | 20 day DMA | 47.91 | | 35 day DMA | 52.95 | | 50 day DMA | 56.94 | | 100 day DMA | 65.55 | | 150 day DMA | 70.53 | | 200 day DMA | 70.35 | EMA (exponential moving average) of Tecnoglass Inc TGLS
| EMA period | EMA current | EMA prev | EMA prev2 | | 5 day EMA | 50.37 | 49.88 | 49.37 | | 12 day EMA | 49.52 | 49.19 | 48.88 | | 20 day EMA | 50.29 | 50.18 | 50.1 | | 35 day EMA | 53.29 | 53.4 | 53.55 | | 50 day EMA | 57.39 | 57.64 | 57.92 |
SMA (simple moving average) of Tecnoglass Inc TGLS
| SMA period | SMA current | SMA prev | SMA prev2 | | 5 day SMA | 50.46 | 50 | 49.5 | | 12 day SMA | 48.44 | 47.93 | 47.43 | | 20 day SMA | 47.91 | 48.14 | 48.47 | | 35 day SMA | 52.95 | 53.29 | 53.68 | | 50 day SMA | 56.94 | 57.32 | 57.71 | | 100 day SMA | 65.55 | 65.81 | 66.07 | | 150 day SMA | 70.53 | 70.67 | 70.81 | | 200 day SMA | 70.35 | 70.46 | 70.59 |
|
|
