TeleflexIncorporated TFX full analysis,charts,indicators,moving averages,SMA,DMA,EMA,ADX,MACD,RSITeleflex Incorporated TFX WideScreen charts, DMA,SMA,EMA technical analysis, forecast prediction, by indicators ADX,MACD,RSI,CCI USA stock exchange
operates under Health Care sector & deals in Medical Dental Instruments
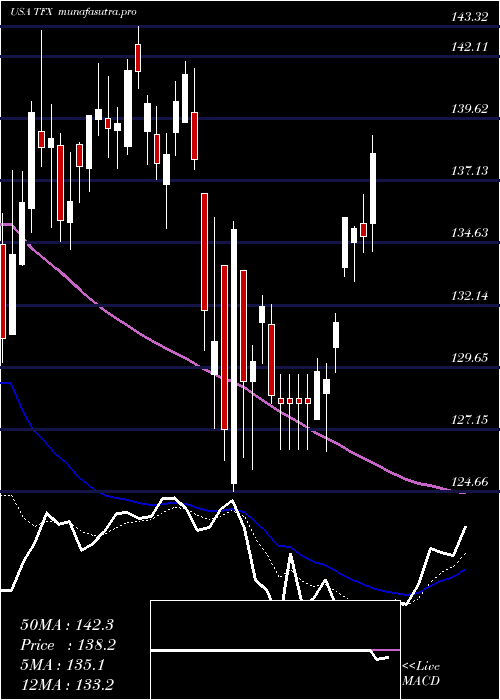
Daily price and charts and targets TeleflexIncorporated Strong Daily Stock price targets for TeleflexIncorporated TFX are 129.52 and 132.32 | Daily Target 1 | 127.31 | | Daily Target 2 | 128.92 | | Daily Target 3 | 130.10666666667 | | Daily Target 4 | 131.72 | | Daily Target 5 | 132.91 |
Daily price and volume Teleflex Incorporated
| Date |
Closing |
Open |
Range |
Volume |
Mon 20 October 2025 |
130.54 (1.88%) |
128.49 |
128.49 - 131.29 |
0.8657 times |
Fri 17 October 2025 |
128.13 (3.43%) |
124.70 |
123.17 - 128.92 |
1.3502 times |
Thu 16 October 2025 |
123.88 (1.98%) |
122.12 |
121.25 - 124.50 |
0.6982 times |
Wed 15 October 2025 |
121.48 (-0.65%) |
122.73 |
121.17 - 123.77 |
0.9511 times |
Tue 14 October 2025 |
122.28 (1.82%) |
118.58 |
118.45 - 123.06 |
0.7955 times |
Mon 13 October 2025 |
120.09 (0.56%) |
119.71 |
119.71 - 122.15 |
1.1069 times |
Fri 10 October 2025 |
119.42 (-4.23%) |
125.09 |
118.97 - 125.85 |
1.4141 times |
Thu 09 October 2025 |
124.70 (-2.9%) |
128.98 |
124.44 - 129.43 |
1.1463 times |
Wed 08 October 2025 |
128.43 (1.21%) |
127.60 |
126.49 - 129.07 |
0.7164 times |
Tue 07 October 2025 |
126.89 (-0.64%) |
128.24 |
126.19 - 128.63 |
0.9556 times |
Mon 06 October 2025 |
127.71 (-2.44%) |
131.54 |
127.32 - 131.54 |
0.5888 times |
Weekly price and charts TeleflexIncorporated Strong weekly Stock price targets for TeleflexIncorporated TFX are 129.52 and 132.32 | Weekly Target 1 | 127.31 | | Weekly Target 2 | 128.92 | | Weekly Target 3 | 130.10666666667 | | Weekly Target 4 | 131.72 | | Weekly Target 5 | 132.91 |
Weekly price and volumes for Teleflex Incorporated
| Date |
Closing |
Open |
Range |
Volume |
Mon 20 October 2025 |
130.54 (1.88%) |
128.49 |
128.49 - 131.29 |
0.165 times |
Fri 17 October 2025 |
128.13 (7.29%) |
119.71 |
118.45 - 128.92 |
0.9341 times |
Fri 10 October 2025 |
119.42 (-8.77%) |
131.54 |
118.97 - 131.54 |
0.9188 times |
Fri 03 October 2025 |
130.90 (9.09%) |
120.41 |
119.11 - 131.80 |
1.098 times |
Fri 26 September 2025 |
119.99 (-2.15%) |
121.82 |
115.73 - 124.68 |
1.4564 times |
Fri 19 September 2025 |
122.63 (-5.89%) |
130.38 |
122.55 - 131.44 |
1.5662 times |
Fri 12 September 2025 |
130.31 (-0.3%) |
130.34 |
128.32 - 133.18 |
1.4764 times |
Fri 05 September 2025 |
130.70 (3.39%) |
125.44 |
123.80 - 131.74 |
1.134 times |
Fri 29 August 2025 |
126.41 (0%) |
126.22 |
125.70 - 127.26 |
0.1891 times |
Fri 29 August 2025 |
126.41 (-2.33%) |
129.28 |
125.39 - 129.76 |
1.062 times |
Fri 22 August 2025 |
129.42 (7.24%) |
120.99 |
119.86 - 129.68 |
1.2959 times |
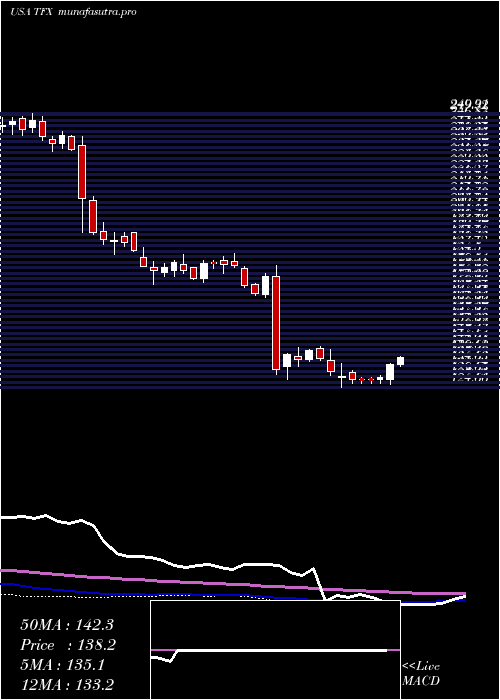
Monthly price and charts TeleflexIncorporated Strong monthly Stock price targets for TeleflexIncorporated TFX are 124.5 and 137.85 | Monthly Target 1 | 113.58 | | Monthly Target 2 | 122.06 | | Monthly Target 3 | 126.93 | | Monthly Target 4 | 135.41 | | Monthly Target 5 | 140.28 |
Monthly price and volumes Teleflex Incorporated
| Date |
Closing |
Open |
Range |
Volume |
Mon 20 October 2025 |
130.54 (6.69%) |
122.73 |
118.45 - 131.80 |
0.4286 times |
Tue 30 September 2025 |
122.36 (-3.2%) |
125.44 |
115.73 - 133.18 |
0.9594 times |
Fri 29 August 2025 |
126.41 (5.78%) |
119.35 |
111.91 - 129.76 |
0.793 times |
Thu 31 July 2025 |
119.50 (0.96%) |
118.77 |
108.90 - 123.97 |
0.84 times |
Mon 30 June 2025 |
118.36 (-3.2%) |
121.71 |
115.94 - 126.87 |
0.6928 times |
Fri 30 May 2025 |
122.27 (-10.78%) |
132.93 |
119.08 - 135.75 |
0.756 times |
Wed 30 April 2025 |
137.05 (-0.82%) |
139.08 |
124.66 - 141.91 |
1.2355 times |
Mon 31 March 2025 |
138.19 (4.1%) |
134.21 |
128.55 - 143.32 |
2.24 times |
Fri 28 February 2025 |
132.75 (-26.35%) |
179.02 |
130.60 - 180.58 |
1.2828 times |
Fri 31 January 2025 |
180.24 (1.27%) |
179.70 |
172.68 - 185.94 |
0.7719 times |
Tue 31 December 2024 |
177.98 (-6.82%) |
186.79 |
171.69 - 188.87 |
0.4867 times |

DMA SMA EMA moving averages of Teleflex Incorporated TFX
DMA (daily moving average) of Teleflex Incorporated TFX
| DMA period | DMA value | | 5 day DMA | 125.26 | | 12 day DMA | 125.37 | | 20 day DMA | 123.96 | | 35 day DMA | 125.55 | | 50 day DMA | 125.32 | | 100 day DMA | 121.78 | | 150 day DMA | 124.87 | | 200 day DMA | 135.47 | EMA (exponential moving average) of Teleflex Incorporated TFX
| EMA period | EMA current | EMA prev | EMA prev2 | | 5 day EMA | 126.55 | 124.56 | 122.77 | | 12 day EMA | 125.15 | 124.17 | 123.45 | | 20 day EMA | 124.84 | 124.24 | 123.83 | | 35 day EMA | 124.49 | 124.13 | 123.89 | | 50 day EMA | 124.54 | 124.29 | 124.13 |
SMA (simple moving average) of Teleflex Incorporated TFX
| SMA period | SMA current | SMA prev | SMA prev2 | | 5 day SMA | 125.26 | 123.17 | 121.43 | | 12 day SMA | 125.37 | 124.95 | 124.6 | | 20 day SMA | 123.96 | 123.58 | 123.3 | | 35 day SMA | 125.55 | 125.43 | 125.38 | | 50 day SMA | 125.32 | 125.03 | 124.84 | | 100 day SMA | 121.78 | 121.7 | 121.63 | | 150 day SMA | 124.87 | 124.92 | 124.98 | | 200 day SMA | 135.47 | 135.72 | 135.97 |
|
|
