TeradyneInc TER full analysis,charts,indicators,moving averages,SMA,DMA,EMA,ADX,MACD,RSITeradyne Inc TER WideScreen charts, DMA,SMA,EMA technical analysis, forecast prediction, by indicators ADX,MACD,RSI,CCI USA stock exchange
operates under Capital Goods sector & deals in Electrical Products
Daily price and charts and targets TeradyneInc Strong Daily Stock price targets for TeradyneInc TER are 195.82 and 203.67 | Daily Target 1 | 189.64 | | Daily Target 2 | 194.14 | | Daily Target 3 | 197.49333333333 | | Daily Target 4 | 201.99 | | Daily Target 5 | 205.34 |
Daily price and volume Teradyne Inc
| Date |
Closing |
Open |
Range |
Volume |
Thu 04 December 2025 |
198.63 (1.82%) |
193.00 |
193.00 - 200.85 |
1.3126 times |
Wed 03 December 2025 |
195.08 (2.7%) |
191.52 |
189.00 - 196.20 |
1.0288 times |
Tue 02 December 2025 |
189.96 (5.75%) |
183.00 |
183.00 - 191.48 |
0.4971 times |
Mon 01 December 2025 |
179.63 (-1.24%) |
179.16 |
178.04 - 182.87 |
0.852 times |
Fri 28 November 2025 |
181.89 (1.4%) |
179.70 |
179.46 - 182.17 |
0.5783 times |
Wed 26 November 2025 |
179.37 (6.98%) |
169.61 |
168.71 - 180.89 |
0.4976 times |
Tue 25 November 2025 |
167.67 (1.02%) |
165.33 |
160.36 - 168.09 |
0.873 times |
Mon 24 November 2025 |
165.97 (4.44%) |
160.00 |
159.50 - 167.61 |
1.5834 times |
Fri 21 November 2025 |
158.91 (1.93%) |
155.33 |
151.52 - 160.62 |
1.1927 times |
Thu 20 November 2025 |
155.90 (-7.33%) |
172.28 |
154.71 - 173.83 |
1.5844 times |
Wed 19 November 2025 |
168.23 (2.75%) |
164.58 |
162.76 - 170.40 |
0.8399 times |
Weekly price and charts TeradyneInc Strong weekly Stock price targets for TeradyneInc TER are 188.34 and 211.15 | Weekly Target 1 | 169.7 | | Weekly Target 2 | 184.16 | | Weekly Target 3 | 192.50666666667 | | Weekly Target 4 | 206.97 | | Weekly Target 5 | 215.32 |
Weekly price and volumes for Teradyne Inc
| Date |
Closing |
Open |
Range |
Volume |
Thu 04 December 2025 |
198.63 (9.2%) |
179.16 |
178.04 - 200.85 |
0.8143 times |
Fri 28 November 2025 |
181.89 (14.46%) |
160.00 |
159.50 - 182.17 |
0.7794 times |
Fri 21 November 2025 |
158.91 (-6.51%) |
168.47 |
151.52 - 173.83 |
1.2278 times |
Fri 14 November 2025 |
169.97 (-6.75%) |
188.38 |
163.20 - 188.75 |
1.0829 times |
Fri 07 November 2025 |
182.28 (0.29%) |
176.26 |
174.50 - 191.56 |
0.9112 times |
Fri 31 October 2025 |
181.76 (0%) |
180.00 |
178.00 - 185.91 |
0.3086 times |
Fri 31 October 2025 |
181.76 (25.98%) |
148.10 |
144.11 - 185.91 |
2.1032 times |
Fri 24 October 2025 |
144.28 (4.43%) |
141.00 |
135.83 - 149.00 |
0.7152 times |
Fri 17 October 2025 |
138.16 (4.6%) |
138.70 |
135.00 - 143.06 |
0.8477 times |
Fri 10 October 2025 |
132.08 (-9.1%) |
147.90 |
131.75 - 150.71 |
1.2096 times |
Fri 03 October 2025 |
145.30 (7.38%) |
137.11 |
133.00 - 149.46 |
0.8988 times |
Monthly price and charts TeradyneInc Strong monthly Stock price targets for TeradyneInc TER are 188.34 and 211.15 | Monthly Target 1 | 169.7 | | Monthly Target 2 | 184.16 | | Monthly Target 3 | 192.50666666667 | | Monthly Target 4 | 206.97 | | Monthly Target 5 | 215.32 |
Monthly price and volumes Teradyne Inc
| Date |
Closing |
Open |
Range |
Volume |
Thu 04 December 2025 |
198.63 (9.2%) |
179.16 |
178.04 - 200.85 |
0.1711 times |
Fri 28 November 2025 |
181.89 (0.07%) |
176.26 |
151.52 - 191.56 |
0.8405 times |
Fri 31 October 2025 |
181.76 (32.05%) |
135.92 |
131.75 - 185.91 |
1.194 times |
Tue 30 September 2025 |
137.64 (16.41%) |
116.19 |
109.56 - 138.24 |
1.2339 times |
Fri 29 August 2025 |
118.24 (10.06%) |
104.38 |
102.42 - 120.19 |
1.0871 times |
Thu 31 July 2025 |
107.43 (19.47%) |
89.52 |
88.60 - 113.43 |
1.4369 times |
Mon 30 June 2025 |
89.92 (14.4%) |
78.00 |
77.78 - 91.74 |
0.9093 times |
Fri 30 May 2025 |
78.60 (5.92%) |
75.16 |
73.11 - 85.85 |
0.7892 times |
Wed 30 April 2025 |
74.21 (-10.16%) |
81.88 |
65.77 - 84.89 |
1.2714 times |
Mon 31 March 2025 |
82.60 (-24.81%) |
110.96 |
79.60 - 111.69 |
1.0667 times |
Fri 28 February 2025 |
109.86 (-5.12%) |
112.58 |
107.42 - 120.64 |
0.6402 times |

DMA SMA EMA moving averages of Teradyne Inc TER
DMA (daily moving average) of Teradyne Inc TER
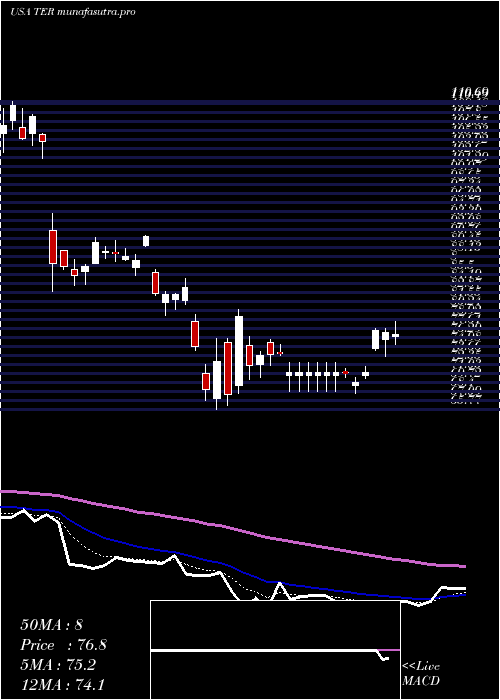
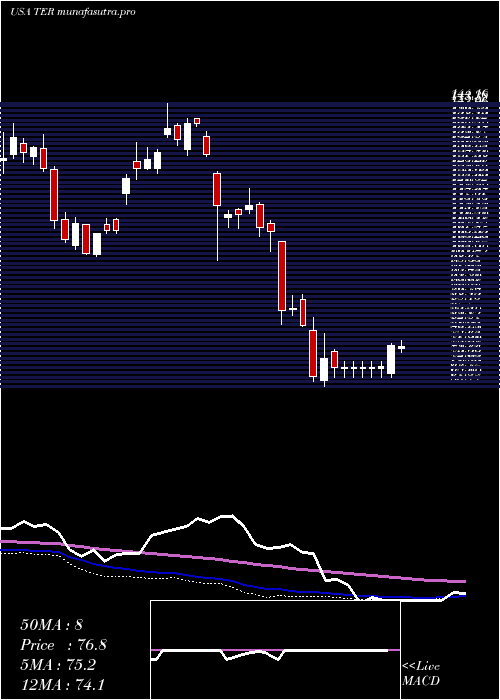
| DMA period | DMA value | | 5 day DMA | 189.04 | | 12 day DMA | 175.41 | | 20 day DMA | 175.99 | | 35 day DMA | 167.92 | | 50 day DMA | 159.52 | | 100 day DMA | 135.02 | | 150 day DMA | 118.3 | | 200 day DMA | 110.35 | EMA (exponential moving average) of Teradyne Inc TER
| EMA period | EMA current | EMA prev | EMA prev2 | | 5 day EMA | 189.79 | 185.37 | 180.51 | | 12 day EMA | 181.19 | 178.02 | 174.92 | | 20 day EMA | 176.15 | 173.79 | 171.55 | | 35 day EMA | 167.29 | 165.44 | 163.7 | | 50 day EMA | 159.97 | 158.39 | 156.89 |
SMA (simple moving average) of Teradyne Inc TER
| SMA period | SMA current | SMA prev | SMA prev2 | | 5 day SMA | 189.04 | 185.19 | 179.7 | | 12 day SMA | 175.41 | 172.81 | 170.72 | | 20 day SMA | 175.99 | 175.44 | 174.47 | | 35 day SMA | 167.92 | 166.28 | 164.62 | | 50 day SMA | 159.52 | 158.21 | 157 | | 100 day SMA | 135.02 | 133.96 | 132.96 | | 150 day SMA | 118.3 | 117.47 | 116.67 | | 200 day SMA | 110.35 | 109.93 | 109.53 |
|
|
