TelefonicaSa TEF full analysis,charts,indicators,moving averages,SMA,DMA,EMA,ADX,MACD,RSITelefonica Sa TEF WideScreen charts, DMA,SMA,EMA technical analysis, forecast prediction, by indicators ADX,MACD,RSI,CCI USA stock exchange
operates under Public Utilities sector & deals in Telecommunications Equipment
Daily price and charts and targets TelefonicaSa Strong Daily Stock price targets for TelefonicaSa TEF are 5.29 and 5.32 | Daily Target 1 | 5.26 | | Daily Target 2 | 5.28 | | Daily Target 3 | 5.29 | | Daily Target 4 | 5.31 | | Daily Target 5 | 5.32 |
Daily price and volume Telefonica Sa
| Date |
Closing |
Open |
Range |
Volume |
Mon 20 October 2025 |
5.30 (1.92%) |
5.30 |
5.27 - 5.30 |
0.7023 times |
Fri 17 October 2025 |
5.20 (0.78%) |
5.18 |
5.17 - 5.21 |
0.8749 times |
Thu 16 October 2025 |
5.16 (0.98%) |
5.12 |
5.12 - 5.17 |
0.5649 times |
Wed 15 October 2025 |
5.11 (1.59%) |
5.15 |
5.11 - 5.19 |
1.1819 times |
Tue 14 October 2025 |
5.03 (1.82%) |
5.02 |
5.01 - 5.05 |
0.8394 times |
Mon 13 October 2025 |
4.94 (-0.8%) |
4.95 |
4.93 - 4.97 |
1.11 times |
Tue 07 October 2025 |
4.98 (0.81%) |
4.98 |
4.96 - 5.00 |
1.0275 times |
Mon 06 October 2025 |
4.94 (-1.4%) |
5.01 |
4.93 - 5.04 |
1.597 times |
Fri 03 October 2025 |
5.01 (-0.2%) |
5.03 |
4.98 - 5.05 |
1.1765 times |
Thu 02 October 2025 |
5.02 (-1.18%) |
5.08 |
5.00 - 5.09 |
0.9256 times |
Wed 01 October 2025 |
5.08 (0%) |
5.12 |
5.06 - 5.13 |
1.0904 times |
Weekly price and charts TelefonicaSa Strong weekly Stock price targets for TelefonicaSa TEF are 5.29 and 5.32 | Weekly Target 1 | 5.26 | | Weekly Target 2 | 5.28 | | Weekly Target 3 | 5.29 | | Weekly Target 4 | 5.31 | | Weekly Target 5 | 5.32 |
Weekly price and volumes for Telefonica Sa
| Date |
Closing |
Open |
Range |
Volume |
Mon 20 October 2025 |
5.30 (1.92%) |
5.30 |
5.27 - 5.30 |
0.1583 times |
Fri 17 October 2025 |
5.20 (4.42%) |
4.95 |
4.93 - 5.21 |
1.0301 times |
Tue 07 October 2025 |
4.98 (-0.6%) |
5.01 |
4.93 - 5.04 |
0.5914 times |
Fri 03 October 2025 |
5.01 (-0.6%) |
5.05 |
4.98 - 5.13 |
1.5305 times |
Fri 26 September 2025 |
5.04 (-4%) |
5.20 |
4.98 - 5.20 |
1.7372 times |
Fri 19 September 2025 |
5.25 (-2.23%) |
5.35 |
5.23 - 5.38 |
1.4864 times |
Fri 12 September 2025 |
5.37 (0.56%) |
5.34 |
5.30 - 5.39 |
1.119 times |
Fri 05 September 2025 |
5.34 (-0.19%) |
5.33 |
5.26 - 5.38 |
0.8721 times |
Fri 29 August 2025 |
5.35 (0%) |
5.29 |
5.29 - 5.37 |
0.2774 times |
Fri 29 August 2025 |
5.35 (-1.47%) |
5.39 |
5.29 - 5.41 |
1.1975 times |
Fri 22 August 2025 |
5.43 (-3.55%) |
5.63 |
5.32 - 5.72 |
1.7428 times |

Monthly price and charts TelefonicaSa Strong monthly Stock price targets for TelefonicaSa TEF are 5.12 and 5.49 | Monthly Target 1 | 4.81 | | Monthly Target 2 | 5.05 | | Monthly Target 3 | 5.1766666666667 | | Monthly Target 4 | 5.42 | | Monthly Target 5 | 5.55 |
Monthly price and volumes Telefonica Sa
| Date |
Closing |
Open |
Range |
Volume |
Mon 20 October 2025 |
5.30 (4.33%) |
5.12 |
4.93 - 5.30 |
0.4452 times |
Tue 30 September 2025 |
5.08 (-5.05%) |
5.33 |
4.98 - 5.39 |
1.0733 times |
Fri 29 August 2025 |
5.35 (4.09%) |
5.19 |
5.16 - 5.72 |
1.0142 times |
Thu 31 July 2025 |
5.14 (-1.72%) |
5.30 |
5.07 - 5.43 |
0.9666 times |
Mon 30 June 2025 |
5.23 (-1.51%) |
5.31 |
5.15 - 5.39 |
0.8124 times |
Fri 30 May 2025 |
5.31 (3.91%) |
5.11 |
4.71 - 5.31 |
1.0859 times |
Wed 30 April 2025 |
5.11 (9.66%) |
4.70 |
4.23 - 5.11 |
1.3505 times |
Mon 31 March 2025 |
4.66 (5.91%) |
4.44 |
4.35 - 4.74 |
1.1471 times |
Fri 28 February 2025 |
4.40 (8.91%) |
4.00 |
3.98 - 4.50 |
0.8294 times |
Fri 31 January 2025 |
4.04 (0.5%) |
4.05 |
3.89 - 4.11 |
1.2755 times |
Tue 31 December 2024 |
4.02 (-10.07%) |
4.52 |
3.99 - 4.53 |
0.8952 times |

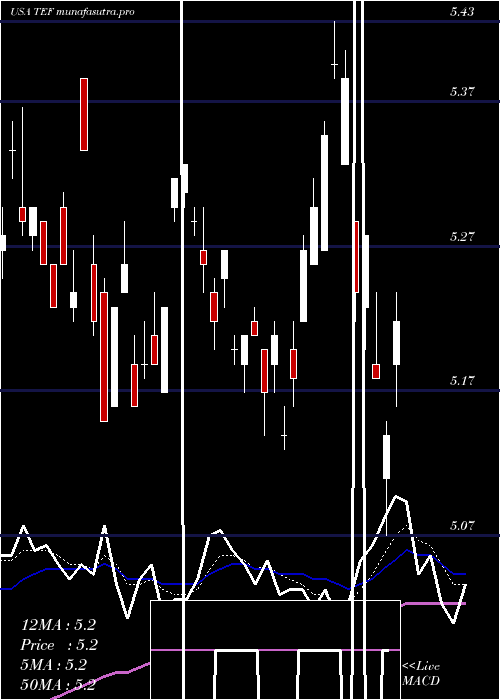
DMA SMA EMA moving averages of Telefonica Sa TEF
DMA (daily moving average) of Telefonica Sa TEF
| DMA period | DMA value | | 5 day DMA | 5.16 | | 12 day DMA | 5.07 | | 20 day DMA | 5.09 | | 35 day DMA | 5.2 | | 50 day DMA | 5.29 | | 100 day DMA | 5.27 | | 150 day DMA | 5.12 | | 200 day DMA | 4.88 | EMA (exponential moving average) of Telefonica Sa TEF
| EMA period | EMA current | EMA prev | EMA prev2 | | 5 day EMA | 5.18 | 5.12 | 5.08 | | 12 day EMA | 5.12 | 5.09 | 5.07 | | 20 day EMA | 5.13 | 5.11 | 5.1 | | 35 day EMA | 5.19 | 5.18 | 5.18 | | 50 day EMA | 5.28 | 5.28 | 5.28 |
SMA (simple moving average) of Telefonica Sa TEF
| SMA period | SMA current | SMA prev | SMA prev2 | | 5 day SMA | 5.16 | 5.09 | 5.04 | | 12 day SMA | 5.07 | 5.05 | 5.04 | | 20 day SMA | 5.09 | 5.1 | 5.1 | | 35 day SMA | 5.2 | 5.2 | 5.21 | | 50 day SMA | 5.29 | 5.29 | 5.29 | | 100 day SMA | 5.27 | 5.27 | 5.27 | | 150 day SMA | 5.12 | 5.11 | 5.11 | | 200 day SMA | 4.88 | 4.88 | 4.87 |
|
|
