TeckResources TECK full analysis,charts,indicators,moving averages,SMA,DMA,EMA,ADX,MACD,RSITeck Resources TECK WideScreen charts, DMA,SMA,EMA technical analysis, forecast prediction, by indicators ADX,MACD,RSI,CCI USA stock exchange
operates under Basic Industries sector & deals in Mining Quarrying Of Nonmetallic Minerals No Fuels
Daily price and charts and targets TeckResources Strong Daily Stock price targets for TeckResources TECK are 43.95 and 44.96 | Daily Target 1 | 43.16 | | Daily Target 2 | 43.72 | | Daily Target 3 | 44.166666666667 | | Daily Target 4 | 44.73 | | Daily Target 5 | 45.18 |
Daily price and volume Teck Resources
| Date |
Closing |
Open |
Range |
Volume |
Mon 20 October 2025 |
44.29 (2.17%) |
44.00 |
43.60 - 44.61 |
0.7536 times |
Fri 17 October 2025 |
43.35 (-2.14%) |
43.59 |
42.49 - 44.12 |
0.9155 times |
Thu 16 October 2025 |
44.30 (1.12%) |
43.53 |
43.44 - 44.73 |
1.2718 times |
Wed 15 October 2025 |
43.81 (1.32%) |
44.00 |
42.76 - 44.08 |
0.8989 times |
Tue 14 October 2025 |
43.24 (-2.98%) |
42.77 |
41.82 - 44.09 |
1.3285 times |
Mon 13 October 2025 |
44.57 (5.12%) |
44.06 |
43.09 - 44.82 |
1.2091 times |
Tue 07 October 2025 |
42.40 (-2.42%) |
43.49 |
42.37 - 43.66 |
1.2817 times |
Mon 06 October 2025 |
43.45 (0.51%) |
42.70 |
42.70 - 44.17 |
0.7442 times |
Fri 03 October 2025 |
43.23 (-0.35%) |
43.93 |
43.00 - 43.98 |
0.8078 times |
Thu 02 October 2025 |
43.38 (-1.68%) |
44.18 |
42.93 - 44.66 |
0.7889 times |
Wed 01 October 2025 |
44.12 (0.52%) |
44.18 |
43.45 - 44.61 |
0.9618 times |
Weekly price and charts TeckResources Strong weekly Stock price targets for TeckResources TECK are 43.95 and 44.96 | Weekly Target 1 | 43.16 | | Weekly Target 2 | 43.72 | | Weekly Target 3 | 44.166666666667 | | Weekly Target 4 | 44.73 | | Weekly Target 5 | 45.18 |
Weekly price and volumes for Teck Resources
| Date |
Closing |
Open |
Range |
Volume |
Mon 20 October 2025 |
44.29 (2.17%) |
44.00 |
43.60 - 44.61 |
0.1135 times |
Fri 17 October 2025 |
43.35 (2.24%) |
44.06 |
41.82 - 44.82 |
0.8472 times |
Tue 07 October 2025 |
42.40 (-1.92%) |
42.70 |
42.37 - 44.17 |
0.3052 times |
Fri 03 October 2025 |
43.23 (4.32%) |
41.84 |
41.50 - 44.66 |
0.8915 times |
Fri 26 September 2025 |
41.44 (5.61%) |
39.39 |
38.04 - 41.69 |
1.3696 times |
Fri 19 September 2025 |
39.24 (-6.33%) |
41.75 |
38.99 - 42.76 |
1.1417 times |
Fri 12 September 2025 |
41.89 (22.09%) |
35.34 |
34.31 - 42.21 |
3.2898 times |
Fri 05 September 2025 |
34.31 (0.35%) |
33.75 |
31.68 - 34.91 |
1.3122 times |
Fri 29 August 2025 |
34.19 (0%) |
33.90 |
33.76 - 34.40 |
0.108 times |
Fri 29 August 2025 |
34.19 (1.73%) |
33.65 |
32.36 - 34.40 |
0.6212 times |
Fri 22 August 2025 |
33.61 (4.25%) |
32.14 |
30.98 - 34.06 |
0.6538 times |

Monthly price and charts TeckResources Strong monthly Stock price targets for TeckResources TECK are 43.06 and 46.06 | Monthly Target 1 | 40.64 | | Monthly Target 2 | 42.47 | | Monthly Target 3 | 43.643333333333 | | Monthly Target 4 | 45.47 | | Monthly Target 5 | 46.64 |
Monthly price and volumes Teck Resources
| Date |
Closing |
Open |
Range |
Volume |
Mon 20 October 2025 |
44.29 (0.91%) |
44.18 |
41.82 - 44.82 |
0.466 times |
Tue 30 September 2025 |
43.89 (28.37%) |
33.75 |
31.68 - 44.42 |
2.1501 times |
Fri 29 August 2025 |
34.19 (5.33%) |
32.00 |
30.98 - 34.40 |
0.7822 times |
Thu 31 July 2025 |
32.46 (-19.61%) |
40.75 |
31.47 - 42.38 |
1.5027 times |
Mon 30 June 2025 |
40.38 (8.99%) |
37.77 |
36.21 - 41.67 |
0.7425 times |
Fri 30 May 2025 |
37.05 (9%) |
34.11 |
33.58 - 38.88 |
0.7938 times |
Wed 30 April 2025 |
33.99 (-6.7%) |
36.17 |
28.32 - 37.68 |
1.127 times |
Mon 31 March 2025 |
36.43 (-9.67%) |
41.46 |
35.14 - 43.30 |
0.947 times |
Fri 28 February 2025 |
40.33 (-1.35%) |
39.36 |
39.05 - 44.49 |
0.7322 times |
Fri 31 January 2025 |
40.88 (0.86%) |
41.15 |
40.44 - 44.50 |
0.7566 times |
Tue 31 December 2024 |
40.53 (-12.46%) |
45.60 |
39.75 - 47.85 |
0.4389 times |

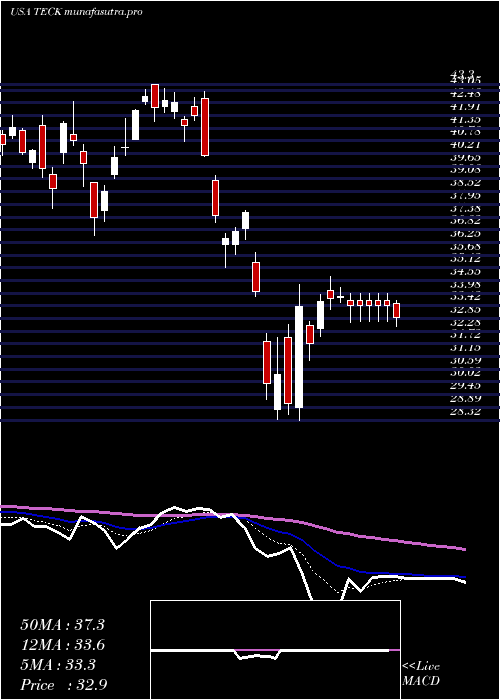
DMA SMA EMA moving averages of Teck Resources TECK
DMA (daily moving average) of Teck Resources TECK
| DMA period | DMA value | | 5 day DMA | 43.8 | | 12 day DMA | 43.67 | | 20 day DMA | 42.28 | | 35 day DMA | 40.06 | | 50 day DMA | 37.79 | | 100 day DMA | 37.63 | | 150 day DMA | 37.04 | | 200 day DMA | 38.19 | EMA (exponential moving average) of Teck Resources TECK
| EMA period | EMA current | EMA prev | EMA prev2 | | 5 day EMA | 43.86 | 43.64 | 43.79 | | 12 day EMA | 43.27 | 43.08 | 43.03 | | 20 day EMA | 42.28 | 42.07 | 41.94 | | 35 day EMA | 40.13 | 39.88 | 39.68 | | 50 day EMA | 37.93 | 37.67 | 37.44 |
SMA (simple moving average) of Teck Resources TECK
| SMA period | SMA current | SMA prev | SMA prev2 | | 5 day SMA | 43.8 | 43.85 | 43.66 | | 12 day SMA | 43.67 | 43.65 | 43.49 | | 20 day SMA | 42.28 | 42.05 | 41.89 | | 35 day SMA | 40.06 | 39.73 | 39.45 | | 50 day SMA | 37.79 | 37.55 | 37.34 | | 100 day SMA | 37.63 | 37.54 | 37.47 | | 150 day SMA | 37.04 | 37.02 | 36.98 | | 200 day SMA | 38.19 | 38.17 | 38.16 |
|
|
