TeledyneTechnologies TDY full analysis,charts,indicators,moving averages,SMA,DMA,EMA,ADX,MACD,RSITeledyne Technologies TDY WideScreen charts, DMA,SMA,EMA technical analysis, forecast prediction, by indicators ADX,MACD,RSI,CCI USA stock exchange
operates under Capital Goods sector & deals in Industrial Machinery Components
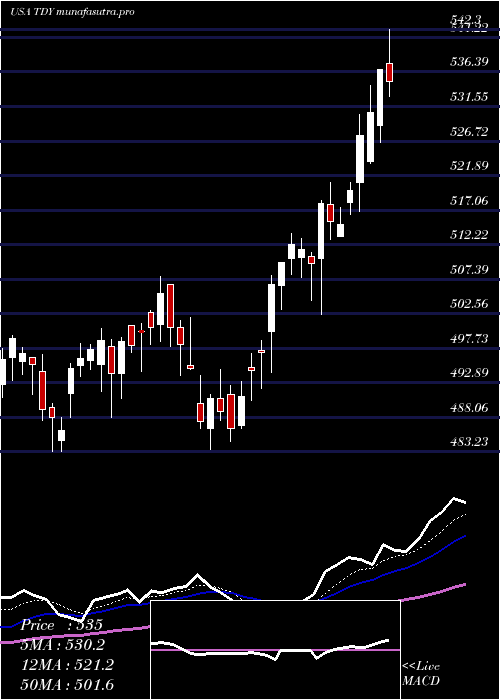
Daily price and charts and targets TeledyneTechnologies Strong Daily Stock price targets for TeledyneTechnologies TDY are 511.03 and 526.47 | Daily Target 1 | 498.41 | | Daily Target 2 | 508.21 | | Daily Target 3 | 513.85333333333 | | Daily Target 4 | 523.65 | | Daily Target 5 | 529.29 |
Daily price and volume Teledyne Technologies
| Date |
Closing |
Open |
Range |
Volume |
Thu 04 December 2025 |
518.00 (2.79%) |
504.61 |
504.06 - 519.50 |
0.9508 times |
Wed 03 December 2025 |
503.96 (1.66%) |
499.02 |
494.46 - 505.04 |
0.816 times |
Tue 02 December 2025 |
495.72 (0.64%) |
495.44 |
492.35 - 498.52 |
0.7907 times |
Mon 01 December 2025 |
492.56 (-1.39%) |
496.89 |
491.28 - 500.54 |
1.0792 times |
Fri 28 November 2025 |
499.52 (0.37%) |
500.55 |
497.69 - 504.52 |
0.5422 times |
Wed 26 November 2025 |
497.68 (-0.02%) |
497.80 |
495.27 - 500.57 |
0.8579 times |
Tue 25 November 2025 |
497.77 (1.1%) |
493.50 |
489.68 - 499.97 |
0.7071 times |
Mon 24 November 2025 |
492.35 (-0.51%) |
493.99 |
490.20 - 498.16 |
1.5136 times |
Fri 21 November 2025 |
494.87 (2.15%) |
485.94 |
483.02 - 496.29 |
1.5686 times |
Thu 20 November 2025 |
484.47 (-1.92%) |
498.17 |
483.82 - 502.93 |
1.1739 times |
Wed 19 November 2025 |
493.94 (-2.03%) |
502.98 |
492.01 - 504.31 |
0.9752 times |
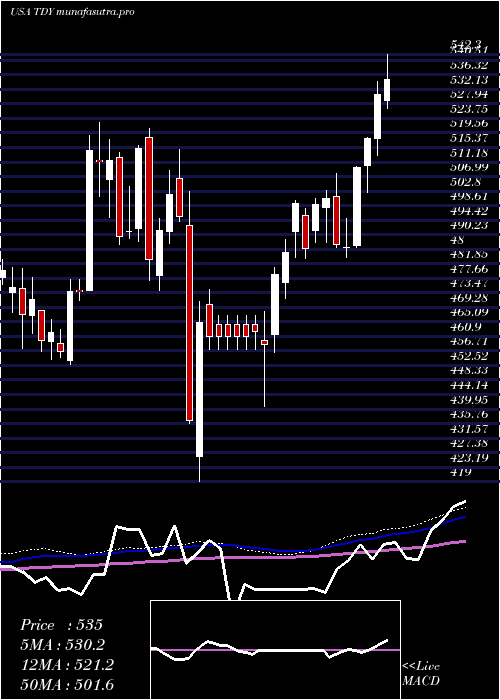
Weekly price and charts TeledyneTechnologies Strong weekly Stock price targets for TeledyneTechnologies TDY are 504.64 and 532.86 | Weekly Target 1 | 481.37 | | Weekly Target 2 | 499.69 | | Weekly Target 3 | 509.59333333333 | | Weekly Target 4 | 527.91 | | Weekly Target 5 | 537.81 |
Weekly price and volumes for Teledyne Technologies
| Date |
Closing |
Open |
Range |
Volume |
Thu 04 December 2025 |
518.00 (3.7%) |
496.89 |
491.28 - 519.50 |
0.9158 times |
Fri 28 November 2025 |
499.52 (0.94%) |
493.99 |
489.68 - 504.52 |
0.9118 times |
Fri 21 November 2025 |
494.87 (-1.27%) |
501.83 |
483.02 - 505.14 |
1.6907 times |
Fri 14 November 2025 |
501.23 (-2.33%) |
516.67 |
496.00 - 523.86 |
1.4355 times |
Fri 07 November 2025 |
513.17 (-2.59%) |
514.23 |
504.00 - 517.98 |
0.8797 times |
Fri 31 October 2025 |
526.82 (0%) |
517.02 |
516.01 - 530.07 |
0.2579 times |
Fri 31 October 2025 |
526.82 (-0.99%) |
534.93 |
513.78 - 535.19 |
1.1629 times |
Fri 24 October 2025 |
532.09 (-5.37%) |
566.25 |
531.00 - 580.14 |
1.3028 times |
Fri 17 October 2025 |
562.26 (-0.91%) |
571.49 |
559.00 - 577.56 |
0.8386 times |
Fri 10 October 2025 |
567.44 (-3.43%) |
589.99 |
565.85 - 595.99 |
0.6042 times |
Fri 03 October 2025 |
587.62 (1.82%) |
579.13 |
571.75 - 590.09 |
0.7936 times |
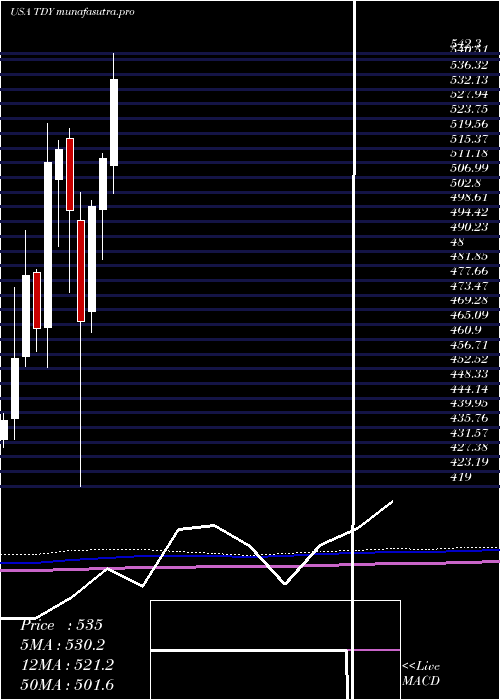
Monthly price and charts TeledyneTechnologies Strong monthly Stock price targets for TeledyneTechnologies TDY are 504.64 and 532.86 | Monthly Target 1 | 481.37 | | Monthly Target 2 | 499.69 | | Monthly Target 3 | 509.59333333333 | | Monthly Target 4 | 527.91 | | Monthly Target 5 | 537.81 |
Monthly price and volumes Teledyne Technologies
| Date |
Closing |
Open |
Range |
Volume |
Thu 04 December 2025 |
518.00 (3.7%) |
496.89 |
491.28 - 519.50 |
0.2209 times |
Fri 28 November 2025 |
499.52 (-5.18%) |
514.23 |
483.02 - 523.86 |
1.1865 times |
Fri 31 October 2025 |
526.82 (-10.11%) |
581.63 |
513.78 - 595.99 |
1.1 times |
Tue 30 September 2025 |
586.04 (8.89%) |
534.85 |
528.81 - 586.28 |
0.9184 times |
Fri 29 August 2025 |
538.17 (-2.33%) |
545.87 |
534.50 - 556.45 |
0.8916 times |
Thu 31 July 2025 |
551.02 (7.56%) |
510.42 |
502.50 - 570.56 |
1.5696 times |
Mon 30 June 2025 |
512.31 (2.7%) |
497.96 |
483.55 - 513.84 |
1.127 times |
Fri 30 May 2025 |
498.86 (7.04%) |
468.79 |
462.77 - 500.53 |
1.083 times |
Wed 30 April 2025 |
466.03 (-6.37%) |
494.82 |
419.00 - 502.60 |
0.9979 times |
Mon 31 March 2025 |
497.71 (-3.36%) |
518.16 |
474.25 - 520.92 |
0.9051 times |
Fri 28 February 2025 |
515.02 (0.72%) |
506.27 |
487.24 - 517.58 |
0.6921 times |
DMA SMA EMA moving averages of Teledyne Technologies TDY
DMA (daily moving average) of Teledyne Technologies TDY
| DMA period | DMA value | | 5 day DMA | 501.95 | | 12 day DMA | 497.92 | | 20 day DMA | 502.78 | | 35 day DMA | 517.2 | | 50 day DMA | 535.48 | | 100 day DMA | 542.7 | | 150 day DMA | 528.08 | | 200 day DMA | 515.92 | EMA (exponential moving average) of Teledyne Technologies TDY
| EMA period | EMA current | EMA prev | EMA prev2 | | 5 day EMA | 504.99 | 498.48 | 495.74 | | 12 day EMA | 502.48 | 499.66 | 498.88 | | 20 day EMA | 506.46 | 505.25 | 505.39 | | 35 day EMA | 519.77 | 519.87 | 520.81 | | 50 day EMA | 534.68 | 535.36 | 536.64 |
SMA (simple moving average) of Teledyne Technologies TDY
| SMA period | SMA current | SMA prev | SMA prev2 | | 5 day SMA | 501.95 | 497.89 | 496.65 | | 12 day SMA | 497.92 | 496.38 | 496.15 | | 20 day SMA | 502.78 | 502.51 | 502.87 | | 35 day SMA | 517.2 | 518.54 | 520.48 | | 50 day SMA | 535.48 | 536.4 | 537.68 | | 100 day SMA | 542.7 | 542.87 | 543.2 | | 150 day SMA | 528.08 | 527.73 | 527.45 | | 200 day SMA | 515.92 | 515.84 | 515.83 |
|
|
