TempletonDragon TDF full analysis,charts,indicators,moving averages,SMA,DMA,EMA,ADX,MACD,RSITempleton Dragon TDF WideScreen charts, DMA,SMA,EMA technical analysis, forecast prediction, by indicators ADX,MACD,RSI,CCI USA stock exchange
operates under N A sector & deals in N A
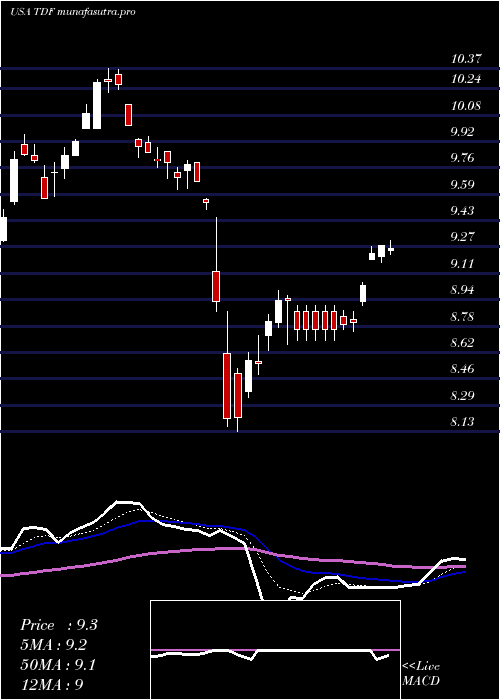
Daily price and charts and targets TempletonDragon Strong Daily Stock price targets for TempletonDragon TDF are 11.35 and 11.56 | Daily Target 1 | 11.18 | | Daily Target 2 | 11.3 | | Daily Target 3 | 11.39 | | Daily Target 4 | 11.51 | | Daily Target 5 | 11.6 |
Daily price and volume Templeton Dragon
| Date |
Closing |
Open |
Range |
Volume |
Mon 20 October 2025 |
11.42 (0%) |
11.35 |
11.27 - 11.48 |
0.4807 times |
Fri 17 October 2025 |
11.42 (0.18%) |
11.28 |
11.26 - 11.45 |
0.2131 times |
Thu 16 October 2025 |
11.40 (0.35%) |
11.44 |
11.25 - 11.47 |
0.457 times |
Wed 15 October 2025 |
11.36 (0.18%) |
11.34 |
11.32 - 11.51 |
0.7473 times |
Tue 14 October 2025 |
11.34 (-0.44%) |
11.25 |
11.04 - 11.68 |
1.3927 times |
Mon 13 October 2025 |
11.39 (2.06%) |
11.35 |
11.26 - 11.61 |
3.5502 times |
Fri 10 October 2025 |
11.16 (-4.45%) |
11.64 |
11.10 - 11.76 |
1.3721 times |
Thu 09 October 2025 |
11.68 (-1.43%) |
11.89 |
11.64 - 12.03 |
0.7885 times |
Wed 08 October 2025 |
11.85 (0.17%) |
11.83 |
11.66 - 11.94 |
0.2975 times |
Tue 07 October 2025 |
11.83 (-0.25%) |
11.79 |
11.73 - 11.96 |
0.701 times |
Mon 06 October 2025 |
11.86 (0.17%) |
11.83 |
11.77 - 11.93 |
0.3638 times |
Weekly price and charts TempletonDragon Strong weekly Stock price targets for TempletonDragon TDF are 11.35 and 11.56 | Weekly Target 1 | 11.18 | | Weekly Target 2 | 11.3 | | Weekly Target 3 | 11.39 | | Weekly Target 4 | 11.51 | | Weekly Target 5 | 11.6 |
Weekly price and volumes for Templeton Dragon
| Date |
Closing |
Open |
Range |
Volume |
Mon 20 October 2025 |
11.42 (0%) |
11.35 |
11.27 - 11.48 |
0.1293 times |
Fri 17 October 2025 |
11.42 (2.33%) |
11.35 |
11.04 - 11.68 |
1.7108 times |
Fri 10 October 2025 |
11.16 (-5.74%) |
11.83 |
11.10 - 12.03 |
0.9476 times |
Fri 03 October 2025 |
11.84 (3.5%) |
11.52 |
11.45 - 12.04 |
1.2533 times |
Fri 26 September 2025 |
11.44 (-0.26%) |
11.47 |
11.29 - 11.79 |
1.8562 times |
Fri 19 September 2025 |
11.47 (-0.61%) |
11.61 |
11.30 - 11.95 |
1.1897 times |
Fri 12 September 2025 |
11.54 (2.94%) |
11.28 |
11.15 - 11.61 |
1.4398 times |
Fri 05 September 2025 |
11.21 (0.18%) |
11.20 |
11.10 - 11.41 |
0.6493 times |
Fri 29 August 2025 |
11.19 (0%) |
10.95 |
10.92 - 11.22 |
0.1802 times |
Fri 29 August 2025 |
11.19 (0.27%) |
11.11 |
10.78 - 11.26 |
0.6437 times |
Fri 22 August 2025 |
11.16 (5.28%) |
10.61 |
10.55 - 11.16 |
0.5886 times |
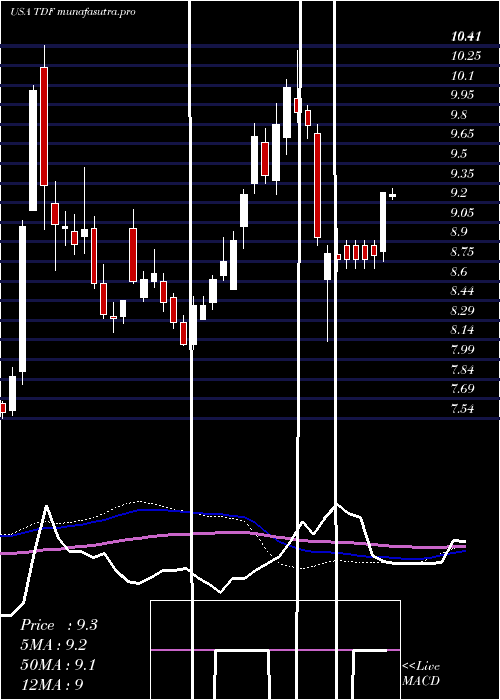
Monthly price and charts TempletonDragon Strong monthly Stock price targets for TempletonDragon TDF are 10.73 and 11.73 | Monthly Target 1 | 10.5 | | Monthly Target 2 | 10.96 | | Monthly Target 3 | 11.5 | | Monthly Target 4 | 11.96 | | Monthly Target 5 | 12.5 |
Monthly price and volumes Templeton Dragon
| Date |
Closing |
Open |
Range |
Volume |
Mon 20 October 2025 |
11.42 (-1.97%) |
11.68 |
11.04 - 12.04 |
0.834 times |
Tue 30 September 2025 |
11.65 (4.11%) |
11.20 |
11.10 - 11.95 |
1.4207 times |
Fri 29 August 2025 |
11.19 (9.49%) |
10.14 |
10.02 - 11.26 |
0.5647 times |
Thu 31 July 2025 |
10.22 (2.3%) |
9.97 |
9.85 - 10.50 |
0.4258 times |
Mon 30 June 2025 |
9.99 (5.49%) |
9.49 |
9.42 - 10.15 |
0.3438 times |
Fri 30 May 2025 |
9.47 (2.38%) |
9.23 |
9.09 - 9.89 |
1.0914 times |
Wed 30 April 2025 |
9.25 (-4.64%) |
9.74 |
8.13 - 9.80 |
0.8425 times |
Mon 31 March 2025 |
9.70 (3.08%) |
9.37 |
9.26 - 10.37 |
1.5072 times |
Fri 28 February 2025 |
9.41 (7.54%) |
8.53 |
8.53 - 9.81 |
1.7001 times |
Fri 31 January 2025 |
8.75 (3.06%) |
8.44 |
8.07 - 8.93 |
1.2699 times |
Tue 31 December 2024 |
8.49 (2.17%) |
8.45 |
8.42 - 9.15 |
1.1229 times |

DMA SMA EMA moving averages of Templeton Dragon TDF
DMA (daily moving average) of Templeton Dragon TDF
| DMA period | DMA value | | 5 day DMA | 11.39 | | 12 day DMA | 11.55 | | 20 day DMA | 11.56 | | 35 day DMA | 11.51 | | 50 day DMA | 11.31 | | 100 day DMA | 10.68 | | 150 day DMA | 10.23 | | 200 day DMA | 9.93 | EMA (exponential moving average) of Templeton Dragon TDF
| EMA period | EMA current | EMA prev | EMA prev2 | | 5 day EMA | 11.41 | 11.41 | 11.41 | | 12 day EMA | 11.48 | 11.49 | 11.5 | | 20 day EMA | 11.48 | 11.49 | 11.5 | | 35 day EMA | 11.37 | 11.37 | 11.37 | | 50 day EMA | 11.25 | 11.24 | 11.23 |
SMA (simple moving average) of Templeton Dragon TDF
| SMA period | SMA current | SMA prev | SMA prev2 | | 5 day SMA | 11.39 | 11.38 | 11.33 | | 12 day SMA | 11.55 | 11.58 | 11.62 | | 20 day SMA | 11.56 | 11.56 | 11.56 | | 35 day SMA | 11.51 | 11.5 | 11.49 | | 50 day SMA | 11.31 | 11.28 | 11.26 | | 100 day SMA | 10.68 | 10.66 | 10.64 | | 150 day SMA | 10.23 | 10.22 | 10.21 | | 200 day SMA | 9.93 | 9.91 | 9.9 |
|
|
