TridentAcquisitions TDAC full analysis,charts,indicators,moving averages,SMA,DMA,EMA,ADX,MACD,RSITrident Acquisitions TDAC WideScreen charts, DMA,SMA,EMA technical analysis, forecast prediction, by indicators ADX,MACD,RSI,CCI USA stock exchange
operates under Finance sector & deals in Business Services
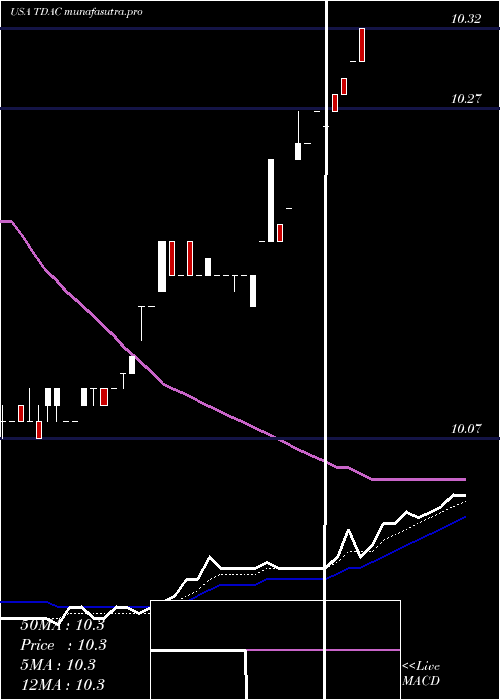
Daily price and charts and targets TridentAcquisitions Strong Daily Stock price targets for TridentAcquisitions TDAC are 10.43 and 10.49 | Daily Target 1 | 10.38 | | Daily Target 2 | 10.42 | | Daily Target 3 | 10.44 | | Daily Target 4 | 10.48 | | Daily Target 5 | 10.5 |
Daily price and volume Trident Acquisitions
| Date |
Closing |
Open |
Range |
Volume |
Tue 21 October 2025 |
10.46 (0.67%) |
10.40 |
10.40 - 10.46 |
5.047 times |
Fri 17 October 2025 |
10.39 (0.1%) |
10.39 |
10.39 - 10.39 |
0.0313 times |
Tue 14 October 2025 |
10.38 (0.29%) |
10.38 |
10.38 - 10.38 |
0.2821 times |
Mon 13 October 2025 |
10.35 (0%) |
10.37 |
10.35 - 10.37 |
0.2194 times |
Fri 10 October 2025 |
10.35 (0%) |
10.35 |
10.35 - 10.37 |
0.4702 times |
Thu 09 October 2025 |
10.35 (0%) |
10.35 |
10.35 - 10.35 |
0.0313 times |
Wed 08 October 2025 |
10.35 (0%) |
10.35 |
10.35 - 10.35 |
0.0313 times |
Tue 07 October 2025 |
10.35 (-0.19%) |
10.37 |
10.35 - 10.37 |
0.3762 times |
Mon 06 October 2025 |
10.37 (0.29%) |
10.34 |
10.34 - 10.37 |
0.094 times |
Fri 03 October 2025 |
10.34 (0%) |
10.37 |
10.34 - 10.37 |
3.4169 times |
Thu 02 October 2025 |
10.34 (0%) |
10.36 |
10.34 - 10.37 |
0.568 times |
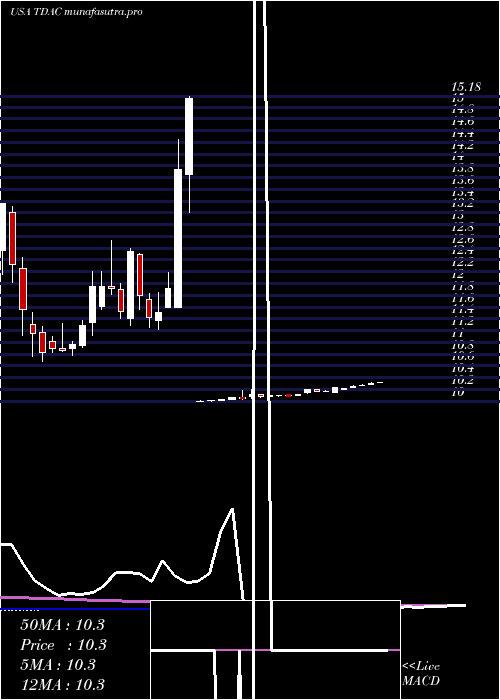
Weekly price and charts TridentAcquisitions Strong weekly Stock price targets for TridentAcquisitions TDAC are 10.43 and 10.49 | Weekly Target 1 | 10.38 | | Weekly Target 2 | 10.42 | | Weekly Target 3 | 10.44 | | Weekly Target 4 | 10.48 | | Weekly Target 5 | 10.5 |
Weekly price and volumes for Trident Acquisitions
| Date |
Closing |
Open |
Range |
Volume |
Tue 21 October 2025 |
10.46 (0.67%) |
10.40 |
10.40 - 10.46 |
0.2453 times |
Fri 17 October 2025 |
10.39 (0.39%) |
10.37 |
10.35 - 10.39 |
0.0259 times |
Fri 10 October 2025 |
10.35 (0.1%) |
10.34 |
10.34 - 10.37 |
0.0488 times |
Fri 03 October 2025 |
10.34 (-0.19%) |
10.35 |
10.34 - 10.37 |
0.212 times |
Wed 24 September 2025 |
10.36 (0.19%) |
10.36 |
10.35 - 10.37 |
0.032 times |
Thu 18 September 2025 |
10.34 (0%) |
10.35 |
10.34 - 10.35 |
2.2885 times |
Wed 10 September 2025 |
10.34 (0%) |
10.34 |
10.33 - 10.34 |
3.061 times |
Thu 04 September 2025 |
10.34 (0%) |
10.35 |
10.34 - 10.35 |
0.2788 times |
Fri 29 August 2025 |
10.34 (0%) |
10.34 |
10.34 - 10.34 |
0.0061 times |
Fri 29 August 2025 |
10.34 (0.19%) |
10.33 |
10.33 - 10.34 |
3.8015 times |
Thu 21 August 2025 |
10.32 (0%) |
10.32 |
10.32 - 10.32 |
6.0764 times |
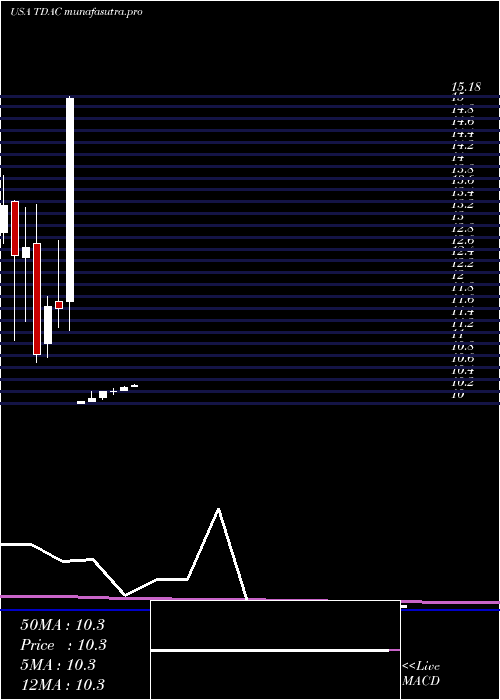
Monthly price and charts TridentAcquisitions Strong monthly Stock price targets for TridentAcquisitions TDAC are 10.4 and 10.52 | Monthly Target 1 | 10.3 | | Monthly Target 2 | 10.38 | | Monthly Target 3 | 10.42 | | Monthly Target 4 | 10.5 | | Monthly Target 5 | 10.54 |
Monthly price and volumes Trident Acquisitions
| Date |
Closing |
Open |
Range |
Volume |
Tue 21 October 2025 |
10.46 (1.06%) |
10.34 |
10.34 - 10.46 |
0.0241 times |
Mon 29 September 2025 |
10.35 (0.1%) |
10.35 |
10.33 - 10.37 |
0.2655 times |
Fri 29 August 2025 |
10.34 (-0.1%) |
10.32 |
10.32 - 10.34 |
0.5361 times |
Mon 28 July 2025 |
10.35 (0.78%) |
10.29 |
10.28 - 10.35 |
0.1211 times |
Fri 20 June 2025 |
10.27 (0.79%) |
10.21 |
10.21 - 10.28 |
0.1287 times |
Tue 27 May 2025 |
10.19 (0%) |
10.19 |
10.15 - 10.24 |
0.0269 times |
Wed 30 April 2025 |
10.19 (1.09%) |
10.09 |
10.07 - 10.19 |
1.1497 times |
Mon 31 March 2025 |
10.08 (0.5%) |
10.03 |
10.03 - 10.20 |
1.2849 times |
Fri 28 February 2025 |
10.03 (-33.75%) |
10.00 |
10.00 - 10.03 |
2.4792 times |
Fri 29 October 2021 |
15.14 (30.52%) |
11.71 |
11.22 - 15.18 |
3.9838 times |
Thu 30 September 2021 |
11.60 (-0.26%) |
11.72 |
11.28 - 12.74 |
1.3822 times |
DMA SMA EMA moving averages of Trident Acquisitions TDAC
DMA (daily moving average) of Trident Acquisitions TDAC
| DMA period | DMA value | | 5 day DMA | 10.39 | | 12 day DMA | 10.36 | | 20 day DMA | 10.36 | | 35 day DMA | 10.34 | | 50 day DMA | 10.31 | | 100 day DMA | 10.2 | | 150 day DMA | 10.78 | | 200 day DMA | 10.97 | EMA (exponential moving average) of Trident Acquisitions TDAC
| EMA period | EMA current | EMA prev | EMA prev2 | | 5 day EMA | 10.41 | 10.38 | 10.37 | | 12 day EMA | 10.38 | 10.36 | 10.35 | | 20 day EMA | 10.35 | 10.34 | 10.33 | | 35 day EMA | 10.32 | 10.31 | 10.3 | | 50 day EMA | 10.3 | 10.29 | 10.29 |
SMA (simple moving average) of Trident Acquisitions TDAC
| SMA period | SMA current | SMA prev | SMA prev2 | | 5 day SMA | 10.39 | 10.36 | 10.36 | | 12 day SMA | 10.36 | 10.36 | 10.35 | | 20 day SMA | 10.36 | 10.35 | 10.35 | | 35 day SMA | 10.34 | 10.34 | 10.34 | | 50 day SMA | 10.31 | 10.31 | 10.3 | | 100 day SMA | 10.2 | 10.19 | 10.19 | | 150 day SMA | 10.78 | 10.79 | 10.79 | | 200 day SMA | 10.97 | 10.98 | 10.99 |
|
|
