TorontoDominion TD full analysis,charts,indicators,moving averages,SMA,DMA,EMA,ADX,MACD,RSIToronto Dominion TD WideScreen charts, DMA,SMA,EMA technical analysis, forecast prediction, by indicators ADX,MACD,RSI,CCI USA stock exchange
operates under Finance sector & deals in Commercial Banks
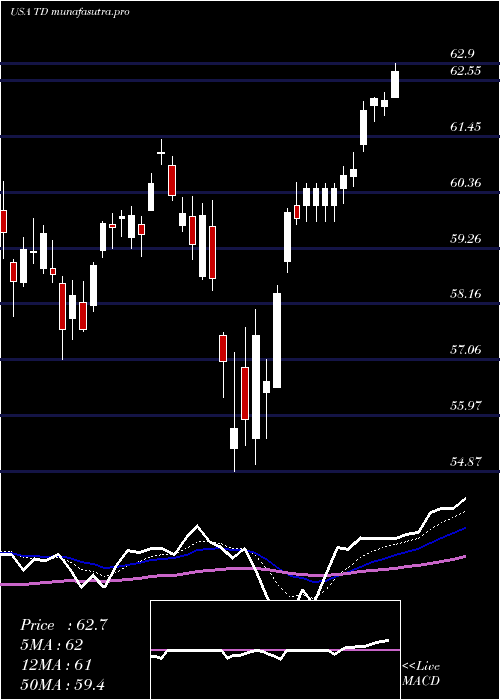
Daily price and charts and targets TorontoDominion Strong Daily Stock price targets for TorontoDominion TD are 79.43 and 80.44 | Daily Target 1 | 78.61 | | Daily Target 2 | 79.24 | | Daily Target 3 | 79.62 | | Daily Target 4 | 80.25 | | Daily Target 5 | 80.63 |
Daily price and volume Toronto Dominion
| Date |
Closing |
Open |
Range |
Volume |
Mon 20 October 2025 |
79.87 (0.86%) |
79.24 |
78.99 - 80.00 |
0.6984 times |
Fri 17 October 2025 |
79.19 (0.6%) |
78.72 |
78.47 - 79.42 |
0.8197 times |
Thu 16 October 2025 |
78.72 (-2.08%) |
80.43 |
78.43 - 80.43 |
1.1216 times |
Wed 15 October 2025 |
80.39 (1.26%) |
79.57 |
79.29 - 80.41 |
0.7969 times |
Tue 14 October 2025 |
79.39 (0.66%) |
78.21 |
77.95 - 79.47 |
0.8909 times |
Mon 13 October 2025 |
78.87 (-2.52%) |
78.68 |
78.16 - 79.11 |
0.5837 times |
Tue 07 October 2025 |
80.91 (-0.39%) |
81.19 |
80.81 - 81.63 |
0.8597 times |
Mon 06 October 2025 |
81.23 (0%) |
81.00 |
80.11 - 81.85 |
0.5965 times |
Fri 03 October 2025 |
81.23 (2.01%) |
80.28 |
80.13 - 81.74 |
1.8918 times |
Thu 02 October 2025 |
79.63 (-1.01%) |
80.48 |
78.99 - 80.57 |
1.7409 times |
Wed 01 October 2025 |
80.44 (0.61%) |
80.06 |
79.92 - 80.84 |
1.8199 times |
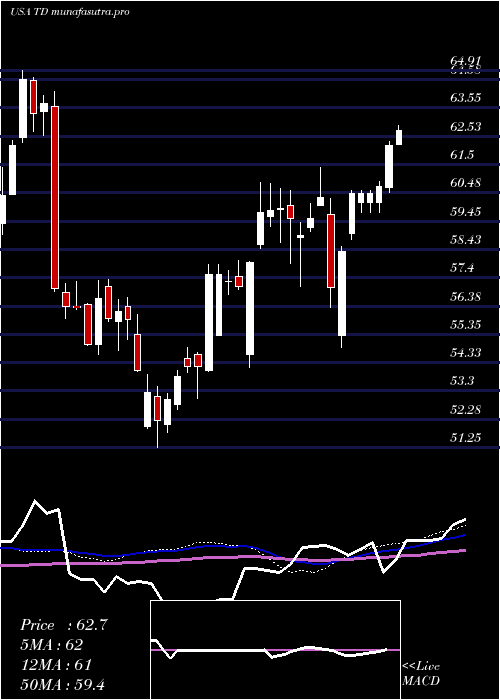
Weekly price and charts TorontoDominion Strong weekly Stock price targets for TorontoDominion TD are 79.43 and 80.44 | Weekly Target 1 | 78.61 | | Weekly Target 2 | 79.24 | | Weekly Target 3 | 79.62 | | Weekly Target 4 | 80.25 | | Weekly Target 5 | 80.63 |
Weekly price and volumes for Toronto Dominion
| Date |
Closing |
Open |
Range |
Volume |
Mon 20 October 2025 |
79.87 (0.86%) |
79.24 |
78.99 - 80.00 |
0.1298 times |
Fri 17 October 2025 |
79.19 (-2.13%) |
78.68 |
77.95 - 80.43 |
0.7832 times |
Tue 07 October 2025 |
80.91 (-0.39%) |
81.00 |
80.11 - 81.85 |
0.2707 times |
Fri 03 October 2025 |
81.23 (2.5%) |
79.36 |
77.26 - 82.08 |
2.1269 times |
Fri 26 September 2025 |
79.25 (0.79%) |
78.46 |
77.79 - 79.42 |
1.1774 times |
Fri 19 September 2025 |
78.63 (2.4%) |
76.95 |
76.73 - 79.49 |
0.9559 times |
Fri 12 September 2025 |
76.79 (3.13%) |
74.68 |
74.11 - 76.92 |
1.0019 times |
Fri 05 September 2025 |
74.46 (-0.9%) |
74.30 |
73.80 - 75.21 |
0.8306 times |
Fri 29 August 2025 |
75.14 (0%) |
73.08 |
72.78 - 75.20 |
0.3931 times |
Fri 29 August 2025 |
75.14 (1.02%) |
74.18 |
72.73 - 78.95 |
2.3304 times |
Fri 22 August 2025 |
74.38 (0.5%) |
74.11 |
73.30 - 74.60 |
0.9052 times |
Monthly price and charts TorontoDominion Strong monthly Stock price targets for TorontoDominion TD are 76.96 and 80.86 | Monthly Target 1 | 75.99 | | Monthly Target 2 | 77.93 | | Monthly Target 3 | 79.89 | | Monthly Target 4 | 81.83 | | Monthly Target 5 | 83.79 |
Monthly price and volumes Toronto Dominion
| Date |
Closing |
Open |
Range |
Volume |
Mon 20 October 2025 |
79.87 (-0.1%) |
80.06 |
77.95 - 81.85 |
0.3941 times |
Tue 30 September 2025 |
79.95 (6.4%) |
74.30 |
73.80 - 82.08 |
0.9108 times |
Fri 29 August 2025 |
75.14 (3.1%) |
72.50 |
72.21 - 78.95 |
1.0687 times |
Thu 31 July 2025 |
72.88 (-0.78%) |
73.38 |
72.72 - 75.58 |
1.0641 times |
Mon 30 June 2025 |
73.45 (6.37%) |
69.11 |
68.99 - 73.52 |
0.8791 times |
Fri 30 May 2025 |
69.05 (8.26%) |
63.64 |
62.79 - 69.30 |
0.8254 times |
Wed 30 April 2025 |
63.78 (6.41%) |
59.89 |
54.87 - 63.92 |
1.2331 times |
Mon 31 March 2025 |
59.94 (0.05%) |
60.00 |
57.08 - 61.39 |
0.8854 times |
Fri 28 February 2025 |
59.91 (4.98%) |
54.64 |
54.14 - 60.86 |
1.0374 times |
Fri 31 January 2025 |
57.07 (7.19%) |
53.33 |
52.96 - 58.01 |
1.7019 times |
Tue 31 December 2024 |
53.24 (-4.72%) |
54.68 |
51.25 - 54.90 |
0.6148 times |

DMA SMA EMA moving averages of Toronto Dominion TD
DMA (daily moving average) of Toronto Dominion TD
| DMA period | DMA value | | 5 day DMA | 79.51 | | 12 day DMA | 79.99 | | 20 day DMA | 79.54 | | 35 day DMA | 77.89 | | 50 day DMA | 76.71 | | 100 day DMA | 74.43 | | 150 day DMA | 69.97 | | 200 day DMA | 66.85 | EMA (exponential moving average) of Toronto Dominion TD
| EMA period | EMA current | EMA prev | EMA prev2 | | 5 day EMA | 79.6 | 79.46 | 79.59 | | 12 day EMA | 79.58 | 79.53 | 79.59 | | 20 day EMA | 79.15 | 79.07 | 79.06 | | 35 day EMA | 78.02 | 77.91 | 77.83 | | 50 day EMA | 76.69 | 76.56 | 76.45 |
SMA (simple moving average) of Toronto Dominion TD
| SMA period | SMA current | SMA prev | SMA prev2 | | 5 day SMA | 79.51 | 79.31 | 79.66 | | 12 day SMA | 79.99 | 79.98 | 79.98 | | 20 day SMA | 79.54 | 79.47 | 79.4 | | 35 day SMA | 77.89 | 77.78 | 77.67 | | 50 day SMA | 76.71 | 76.58 | 76.46 | | 100 day SMA | 74.43 | 74.28 | 74.14 | | 150 day SMA | 69.97 | 69.82 | 69.69 | | 200 day SMA | 66.85 | 66.71 | 66.58 |
|
|
