BlackrockTcp TCPC full analysis,charts,indicators,moving averages,SMA,DMA,EMA,ADX,MACD,RSIBlackrock Tcp TCPC WideScreen charts, DMA,SMA,EMA technical analysis, forecast prediction, by indicators ADX,MACD,RSI,CCI USA stock exchange
operates under N A sector & deals in N A
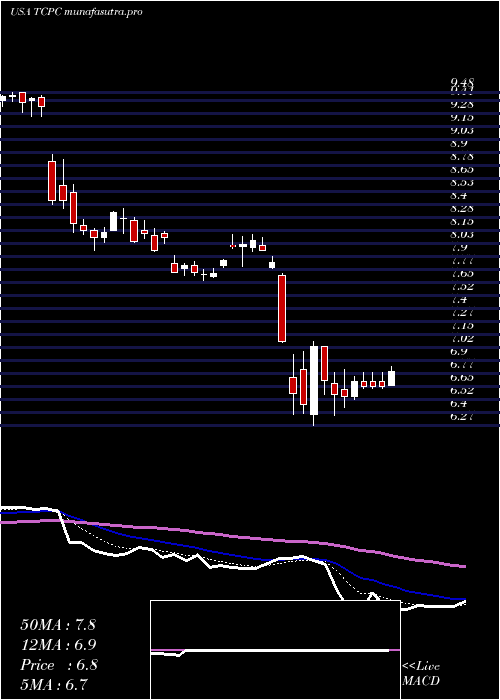
Daily price and charts and targets BlackrockTcp Strong Daily Stock price targets for BlackrockTcp TCPC are 6.06 and 6.17 | Daily Target 1 | 6.03 | | Daily Target 2 | 6.08 | | Daily Target 3 | 6.14 | | Daily Target 4 | 6.19 | | Daily Target 5 | 6.25 |
Daily price and volume Blackrock Tcp
| Date |
Closing |
Open |
Range |
Volume |
Thu 04 December 2025 |
6.13 (-0.16%) |
6.14 |
6.09 - 6.20 |
1.0725 times |
Wed 03 December 2025 |
6.14 (2.33%) |
6.00 |
6.00 - 6.18 |
0.9542 times |
Tue 02 December 2025 |
6.00 (-0.66%) |
6.01 |
5.93 - 6.04 |
1.0658 times |
Mon 01 December 2025 |
6.04 (0.67%) |
6.00 |
5.99 - 6.09 |
1.2526 times |
Fri 28 November 2025 |
6.00 (1.69%) |
5.93 |
5.93 - 6.05 |
0.5922 times |
Wed 26 November 2025 |
5.90 (0.68%) |
5.84 |
5.80 - 5.95 |
0.7448 times |
Tue 25 November 2025 |
5.86 (2.45%) |
5.71 |
5.70 - 5.87 |
1.0915 times |
Mon 24 November 2025 |
5.72 (0.7%) |
5.68 |
5.67 - 5.75 |
0.7364 times |
Fri 21 November 2025 |
5.68 (0.89%) |
5.60 |
5.58 - 5.73 |
0.9826 times |
Thu 20 November 2025 |
5.63 (0.36%) |
5.61 |
5.55 - 5.68 |
1.5075 times |
Wed 19 November 2025 |
5.61 (0.36%) |
5.58 |
5.56 - 5.66 |
1.028 times |
Weekly price and charts BlackrockTcp Strong weekly Stock price targets for BlackrockTcp TCPC are 6.03 and 6.3 | Weekly Target 1 | 5.82 | | Weekly Target 2 | 5.97 | | Weekly Target 3 | 6.0866666666667 | | Weekly Target 4 | 6.24 | | Weekly Target 5 | 6.36 |
Weekly price and volumes for Blackrock Tcp
| Date |
Closing |
Open |
Range |
Volume |
Thu 04 December 2025 |
6.13 (2.17%) |
6.00 |
5.93 - 6.20 |
0.875 times |
Fri 28 November 2025 |
6.00 (5.63%) |
5.68 |
5.67 - 6.05 |
0.6374 times |
Fri 21 November 2025 |
5.68 (-1.9%) |
5.76 |
5.55 - 5.76 |
1.1403 times |
Fri 14 November 2025 |
5.79 (1.58%) |
5.73 |
5.59 - 5.91 |
0.9726 times |
Fri 07 November 2025 |
5.70 (0.35%) |
5.60 |
5.48 - 6.04 |
1.0993 times |
Fri 31 October 2025 |
5.68 (0%) |
5.65 |
5.65 - 5.83 |
0.2174 times |
Fri 31 October 2025 |
5.68 (-1.9%) |
5.82 |
5.65 - 5.95 |
1.1001 times |
Fri 24 October 2025 |
5.79 (3.76%) |
5.60 |
5.58 - 5.82 |
0.7855 times |
Fri 17 October 2025 |
5.58 (2.2%) |
5.49 |
5.49 - 5.87 |
1.2121 times |
Fri 10 October 2025 |
5.46 (-9.9%) |
6.10 |
5.39 - 6.10 |
1.9604 times |
Fri 03 October 2025 |
6.06 (-2.88%) |
6.24 |
6.03 - 6.28 |
1.5114 times |

Monthly price and charts BlackrockTcp Strong monthly Stock price targets for BlackrockTcp TCPC are 6.03 and 6.3 | Monthly Target 1 | 5.82 | | Monthly Target 2 | 5.97 | | Monthly Target 3 | 6.0866666666667 | | Monthly Target 4 | 6.24 | | Monthly Target 5 | 6.36 |
Monthly price and volumes Blackrock Tcp
| Date |
Closing |
Open |
Range |
Volume |
Thu 04 December 2025 |
6.13 (2.17%) |
6.00 |
5.93 - 6.20 |
0.2094 times |
Fri 28 November 2025 |
6.00 (5.63%) |
5.60 |
5.48 - 6.05 |
0.921 times |
Fri 31 October 2025 |
5.68 (-8.39%) |
6.18 |
5.39 - 6.19 |
1.4445 times |
Tue 30 September 2025 |
6.20 (-14.01%) |
7.20 |
6.12 - 7.28 |
1.3506 times |
Fri 29 August 2025 |
7.21 (0.56%) |
7.10 |
6.81 - 7.26 |
0.9641 times |
Thu 31 July 2025 |
7.17 (-6.88%) |
7.66 |
7.10 - 7.92 |
0.7882 times |
Mon 30 June 2025 |
7.70 (-1.79%) |
7.81 |
7.21 - 8.06 |
0.8314 times |
Fri 30 May 2025 |
7.84 (14.62%) |
6.84 |
6.53 - 7.89 |
1.062 times |
Wed 30 April 2025 |
6.84 (-14.61%) |
7.98 |
6.27 - 8.11 |
1.178 times |
Mon 31 March 2025 |
8.01 (-5.09%) |
8.51 |
7.67 - 8.59 |
1.2506 times |
Fri 28 February 2025 |
8.44 (-8.36%) |
9.06 |
8.36 - 9.48 |
1.0273 times |

DMA SMA EMA moving averages of Blackrock Tcp TCPC
DMA (daily moving average) of Blackrock Tcp TCPC
| DMA period | DMA value | | 5 day DMA | 6.06 | | 12 day DMA | 5.86 | | 20 day DMA | 5.81 | | 35 day DMA | 5.77 | | 50 day DMA | 5.81 | | 100 day DMA | 6.47 | | 150 day DMA | 6.85 | | 200 day DMA | 7.08 | EMA (exponential moving average) of Blackrock Tcp TCPC
| EMA period | EMA current | EMA prev | EMA prev2 | | 5 day EMA | 6.05 | 6.01 | 5.95 | | 12 day EMA | 5.94 | 5.9 | 5.86 | | 20 day EMA | 5.87 | 5.84 | 5.81 | | 35 day EMA | 5.88 | 5.86 | 5.84 | | 50 day EMA | 5.9 | 5.89 | 5.88 |
SMA (simple moving average) of Blackrock Tcp TCPC
| SMA period | SMA current | SMA prev | SMA prev2 | | 5 day SMA | 6.06 | 6.02 | 5.96 | | 12 day SMA | 5.86 | 5.82 | 5.79 | | 20 day SMA | 5.81 | 5.78 | 5.76 | | 35 day SMA | 5.77 | 5.76 | 5.75 | | 50 day SMA | 5.81 | 5.81 | 5.82 | | 100 day SMA | 6.47 | 6.49 | 6.51 | | 150 day SMA | 6.85 | 6.85 | 6.86 | | 200 day SMA | 7.08 | 7.09 | 7.11 |
|
|
