TactileSystems TCMD full analysis,charts,indicators,moving averages,SMA,DMA,EMA,ADX,MACD,RSITactile Systems TCMD WideScreen charts, DMA,SMA,EMA technical analysis, forecast prediction, by indicators ADX,MACD,RSI,CCI USA stock exchange
operates under Health Care sector & deals in Medical Dental Instruments
Daily price and charts and targets TactileSystems Strong Daily Stock price targets for TactileSystems TCMD are 14.62 and 14.92 | Daily Target 1 | 14.37 | | Daily Target 2 | 14.57 | | Daily Target 3 | 14.673333333333 | | Daily Target 4 | 14.87 | | Daily Target 5 | 14.97 |
Daily price and volume Tactile Systems
| Date |
Closing |
Open |
Range |
Volume |
Tue 21 October 2025 |
14.76 (1.03%) |
14.48 |
14.48 - 14.78 |
0.6939 times |
Mon 20 October 2025 |
14.61 (0.55%) |
14.66 |
14.46 - 14.80 |
1.2976 times |
Fri 17 October 2025 |
14.53 (-1.09%) |
14.56 |
14.44 - 14.75 |
0.6781 times |
Thu 16 October 2025 |
14.69 (0.27%) |
14.65 |
14.55 - 14.88 |
1.1061 times |
Wed 15 October 2025 |
14.65 (0.27%) |
14.71 |
14.43 - 14.99 |
0.8519 times |
Tue 14 October 2025 |
14.61 (2.17%) |
14.12 |
14.00 - 14.72 |
1.2693 times |
Mon 13 October 2025 |
14.30 (0.56%) |
14.38 |
14.02 - 14.42 |
1.3984 times |
Fri 10 October 2025 |
14.22 (-2.47%) |
14.57 |
14.19 - 14.59 |
1.0257 times |
Thu 09 October 2025 |
14.58 (-2.15%) |
14.86 |
14.45 - 14.86 |
0.873 times |
Wed 08 October 2025 |
14.90 (0.4%) |
14.86 |
14.74 - 15.00 |
0.8058 times |
Tue 07 October 2025 |
14.84 (-2.18%) |
15.11 |
14.80 - 15.14 |
0.79 times |
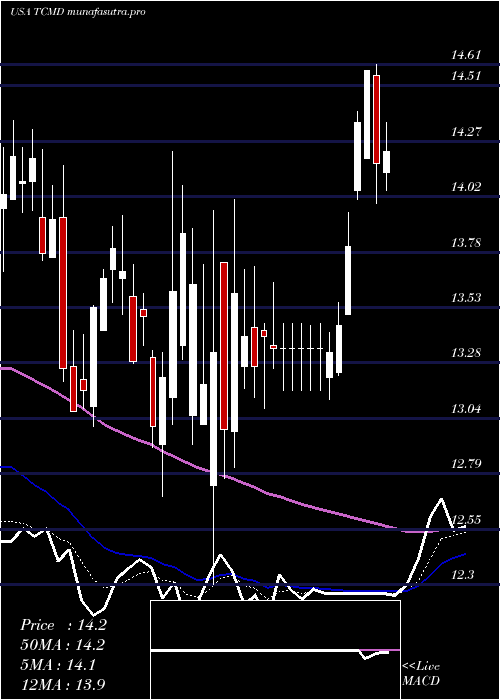
Weekly price and charts TactileSystems Strong weekly Stock price targets for TactileSystems TCMD are 14.61 and 14.95 | Weekly Target 1 | 14.33 | | Weekly Target 2 | 14.55 | | Weekly Target 3 | 14.673333333333 | | Weekly Target 4 | 14.89 | | Weekly Target 5 | 15.01 |
Weekly price and volumes for Tactile Systems
| Date |
Closing |
Open |
Range |
Volume |
Tue 21 October 2025 |
14.76 (1.58%) |
14.66 |
14.46 - 14.80 |
0.4003 times |
Fri 17 October 2025 |
14.53 (2.18%) |
14.38 |
14.00 - 14.99 |
1.0661 times |
Fri 10 October 2025 |
14.22 (-6.45%) |
15.28 |
14.19 - 15.48 |
0.9405 times |
Fri 03 October 2025 |
15.20 (10.3%) |
13.81 |
13.48 - 15.30 |
1.1127 times |
Fri 26 September 2025 |
13.78 (-1.99%) |
14.00 |
13.39 - 14.36 |
1.0845 times |
Fri 19 September 2025 |
14.06 (4.07%) |
13.51 |
13.37 - 14.15 |
1.533 times |
Fri 12 September 2025 |
13.51 (0.37%) |
13.47 |
13.14 - 13.81 |
1.1945 times |
Fri 05 September 2025 |
13.46 (1.13%) |
13.24 |
12.91 - 13.64 |
1.3368 times |
Fri 29 August 2025 |
13.31 (0%) |
13.23 |
13.11 - 13.35 |
0.2872 times |
Fri 29 August 2025 |
13.31 (0.6%) |
13.14 |
12.81 - 13.35 |
1.0444 times |
Fri 22 August 2025 |
13.23 (6.61%) |
12.40 |
12.25 - 13.34 |
1.1741 times |

Monthly price and charts TactileSystems Strong monthly Stock price targets for TactileSystems TCMD are 14.12 and 16.12 | Monthly Target 1 | 12.57 | | Monthly Target 2 | 13.67 | | Monthly Target 3 | 14.573333333333 | | Monthly Target 4 | 15.67 | | Monthly Target 5 | 16.57 |
Monthly price and volumes Tactile Systems
| Date |
Closing |
Open |
Range |
Volume |
Tue 21 October 2025 |
14.76 (6.65%) |
13.75 |
13.48 - 15.48 |
0.4532 times |
Tue 30 September 2025 |
13.84 (3.98%) |
13.24 |
12.91 - 14.36 |
0.8297 times |
Fri 29 August 2025 |
13.31 (33.37%) |
9.93 |
9.60 - 13.83 |
1.0677 times |
Thu 31 July 2025 |
9.98 (-1.58%) |
10.08 |
9.41 - 10.76 |
0.7608 times |
Mon 30 June 2025 |
10.14 (2.63%) |
9.87 |
9.80 - 10.67 |
0.963 times |
Fri 30 May 2025 |
9.88 (-30.03%) |
14.08 |
8.61 - 14.27 |
1.9191 times |
Wed 30 April 2025 |
14.12 (6.81%) |
13.13 |
12.30 - 14.61 |
0.8551 times |
Mon 31 March 2025 |
13.22 (-7.49%) |
14.27 |
12.69 - 14.49 |
0.8498 times |
Fri 28 February 2025 |
14.29 (-18.39%) |
17.11 |
14.02 - 18.06 |
1.4357 times |
Fri 31 January 2025 |
17.51 (2.22%) |
17.37 |
16.94 - 18.51 |
0.866 times |
Tue 31 December 2024 |
17.13 (-6.55%) |
18.38 |
16.68 - 18.99 |
0.7266 times |

DMA SMA EMA moving averages of Tactile Systems TCMD
DMA (daily moving average) of Tactile Systems TCMD
| DMA period | DMA value | | 5 day DMA | 14.65 | | 12 day DMA | 14.66 | | 20 day DMA | 14.39 | | 35 day DMA | 14.09 | | 50 day DMA | 13.75 | | 100 day DMA | 12.05 | | 150 day DMA | 12.16 | | 200 day DMA | 13.17 | EMA (exponential moving average) of Tactile Systems TCMD
| EMA period | EMA current | EMA prev | EMA prev2 | | 5 day EMA | 14.65 | 14.59 | 14.58 | | 12 day EMA | 14.56 | 14.52 | 14.5 | | 20 day EMA | 14.4 | 14.36 | 14.33 | | 35 day EMA | 14.05 | 14.01 | 13.97 | | 50 day EMA | 13.71 | 13.67 | 13.63 |
SMA (simple moving average) of Tactile Systems TCMD
| SMA period | SMA current | SMA prev | SMA prev2 | | 5 day SMA | 14.65 | 14.62 | 14.56 | | 12 day SMA | 14.66 | 14.69 | 14.64 | | 20 day SMA | 14.39 | 14.36 | 14.34 | | 35 day SMA | 14.09 | 14.05 | 14.01 | | 50 day SMA | 13.75 | 13.7 | 13.65 | | 100 day SMA | 12.05 | 12 | 11.95 | | 150 day SMA | 12.16 | 12.15 | 12.15 | | 200 day SMA | 13.17 | 13.19 | 13.2 |
|
|
