Tuanche TC full analysis,charts,indicators,moving averages,SMA,DMA,EMA,ADX,MACD,RSITuanche TC WideScreen charts, DMA,SMA,EMA technical analysis, forecast prediction, by indicators ADX,MACD,RSI,CCI USA stock exchange
operates under Miscellaneous sector & deals in Business Services
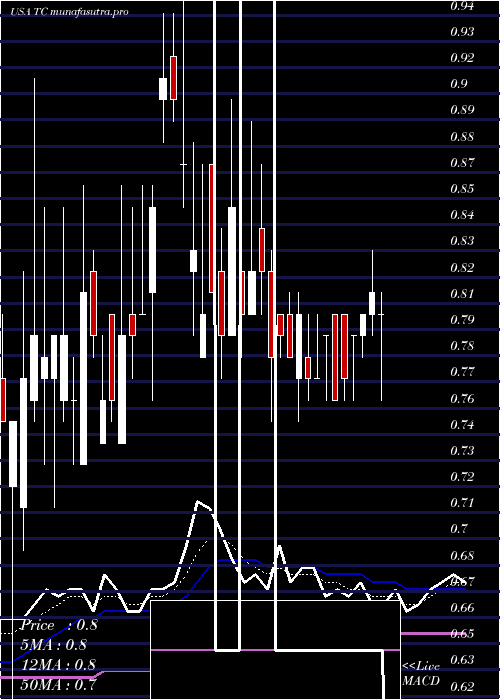
Daily price and charts and targets Tuanche Strong Daily Stock price targets for Tuanche TC are 17.12 and 17.39 | Daily Target 1 | 16.89 | | Daily Target 2 | 17.07 | | Daily Target 3 | 17.16 | | Daily Target 4 | 17.34 | | Daily Target 5 | 17.43 |
Daily price and volume Tuanche
| Date |
Closing |
Open |
Range |
Volume |
Thu 04 December 2025 |
17.25 (1.59%) |
17.04 |
16.98 - 17.25 |
0.0797 times |
Wed 03 December 2025 |
16.98 (-0.35%) |
17.19 |
16.98 - 17.20 |
0.3851 times |
Tue 02 December 2025 |
17.04 (-0.64%) |
17.50 |
16.35 - 17.50 |
0.7171 times |
Mon 01 December 2025 |
17.15 (-0.46%) |
16.90 |
16.75 - 17.15 |
0.1062 times |
Fri 28 November 2025 |
17.23 (-0.98%) |
17.50 |
16.51 - 17.50 |
0.1594 times |
Wed 26 November 2025 |
17.40 (0.64%) |
16.26 |
16.26 - 17.40 |
0.2656 times |
Tue 25 November 2025 |
17.29 (4.92%) |
17.29 |
17.29 - 17.29 |
0.0531 times |
Mon 24 November 2025 |
16.48 (-0.18%) |
18.10 |
16.30 - 18.10 |
0.4117 times |
Fri 21 November 2025 |
16.51 (-3.96%) |
16.20 |
15.75 - 17.41 |
4.2231 times |
Thu 20 November 2025 |
17.19 (-5.55%) |
17.87 |
16.50 - 18.58 |
3.5989 times |
Wed 19 November 2025 |
18.20 (-3.29%) |
18.21 |
17.82 - 18.21 |
0.1328 times |
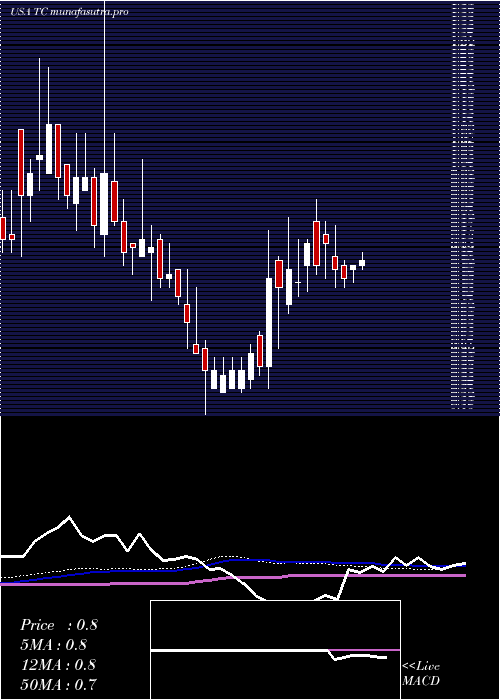
Weekly price and charts Tuanche Strong weekly Stock price targets for Tuanche TC are 16.8 and 17.95 | Weekly Target 1 | 15.88 | | Weekly Target 2 | 16.57 | | Weekly Target 3 | 17.033333333333 | | Weekly Target 4 | 17.72 | | Weekly Target 5 | 18.18 |
Weekly price and volumes for Tuanche
| Date |
Closing |
Open |
Range |
Volume |
Thu 04 December 2025 |
17.25 (0.12%) |
16.90 |
16.35 - 17.50 |
0.2136 times |
Fri 28 November 2025 |
17.23 (4.36%) |
18.10 |
16.26 - 18.10 |
0.1475 times |
Fri 21 November 2025 |
16.51 (-9.83%) |
17.07 |
15.75 - 18.82 |
1.3587 times |
Fri 14 November 2025 |
18.31 (0.66%) |
19.66 |
17.57 - 19.66 |
0.5792 times |
Fri 07 November 2025 |
18.19 (11.94%) |
16.95 |
16.50 - 19.99 |
0.4426 times |
Fri 31 October 2025 |
16.25 (0%) |
15.13 |
15.13 - 16.25 |
0.1938 times |
Fri 31 October 2025 |
16.25 (5.18%) |
16.00 |
14.36 - 16.25 |
1.1517 times |
Fri 24 October 2025 |
15.45 (-4.63%) |
15.76 |
14.50 - 17.10 |
1.6252 times |
Fri 17 October 2025 |
16.20 (11.72%) |
14.98 |
14.23 - 18.00 |
2.1317 times |
Fri 10 October 2025 |
14.50 (8.29%) |
13.40 |
12.90 - 15.41 |
2.1559 times |
Fri 03 October 2025 |
13.39 (-0.45%) |
12.70 |
12.70 - 14.29 |
1.1637 times |
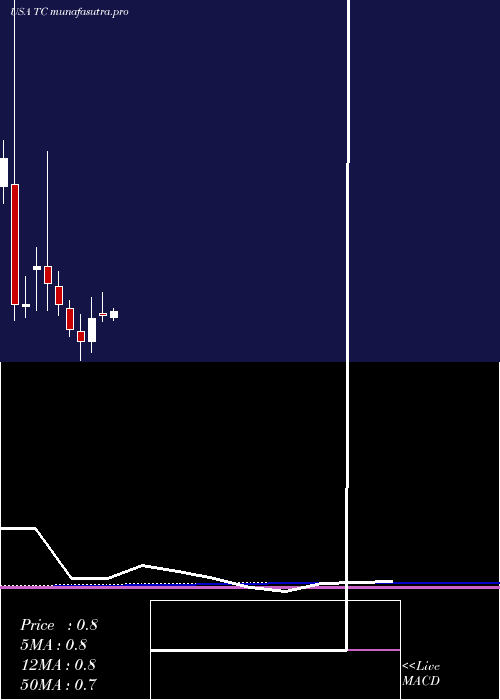
Monthly price and charts Tuanche Strong monthly Stock price targets for Tuanche TC are 16.8 and 17.95 | Monthly Target 1 | 15.88 | | Monthly Target 2 | 16.57 | | Monthly Target 3 | 17.033333333333 | | Monthly Target 4 | 17.72 | | Monthly Target 5 | 18.18 |
Monthly price and volumes Tuanche
| Date |
Closing |
Open |
Range |
Volume |
Thu 04 December 2025 |
17.25 (0.12%) |
16.90 |
16.35 - 17.50 |
0.0035 times |
Fri 28 November 2025 |
17.23 (6.03%) |
16.95 |
15.75 - 19.99 |
0.0411 times |
Fri 31 October 2025 |
16.25 (17.16%) |
12.80 |
12.72 - 18.00 |
0.125 times |
Tue 30 September 2025 |
13.87 (5.64%) |
14.59 |
11.53 - 22.46 |
0.2269 times |
Fri 29 August 2025 |
13.13 (1830.88%) |
0.68 |
0.48 - 14.35 |
3.4657 times |
Thu 31 July 2025 |
0.68 (-12.82%) |
0.77 |
0.67 - 0.83 |
0.3173 times |
Mon 30 June 2025 |
0.78 (2.63%) |
0.80 |
0.74 - 0.95 |
1.5261 times |
Fri 30 May 2025 |
0.76 (26.67%) |
0.60 |
0.52 - 0.91 |
3.9025 times |
Wed 30 April 2025 |
0.60 (-11.76%) |
0.67 |
0.46 - 0.79 |
0.1723 times |
Mon 31 March 2025 |
0.68 (-20.93%) |
0.83 |
0.63 - 0.89 |
0.2195 times |
Fri 28 February 2025 |
0.86 (-14.85%) |
0.99 |
0.78 - 1.10 |
1.5154 times |
DMA SMA EMA moving averages of Tuanche TC
DMA (daily moving average) of Tuanche TC
| DMA period | DMA value | | 5 day DMA | 17.13 | | 12 day DMA | 17.3 | | 20 day DMA | 17.73 | | 35 day DMA | 17.05 | | 50 day DMA | 16.22 | | 100 day DMA | 10.98 | | 150 day DMA | 7.58 | | 200 day DMA | 5.86 | EMA (exponential moving average) of Tuanche TC
| EMA period | EMA current | EMA prev | EMA prev2 | | 5 day EMA | 17.15 | 17.1 | 17.16 | | 12 day EMA | 17.28 | 17.28 | 17.33 | | 20 day EMA | 17.22 | 17.22 | 17.25 | | 35 day EMA | 16.77 | 16.74 | 16.73 | | 50 day EMA | 16.16 | 16.12 | 16.08 |
SMA (simple moving average) of Tuanche TC
| SMA period | SMA current | SMA prev | SMA prev2 | | 5 day SMA | 17.13 | 17.16 | 17.22 | | 12 day SMA | 17.3 | 17.38 | 17.49 | | 20 day SMA | 17.73 | 17.78 | 17.83 | | 35 day SMA | 17.05 | 17.04 | 17.02 | | 50 day SMA | 16.22 | 16.15 | 16.1 | | 100 day SMA | 10.98 | 10.82 | 10.66 | | 150 day SMA | 7.58 | 7.47 | 7.36 | | 200 day SMA | 5.86 | 5.78 | 5.7 |
|
|
