TrueblueInc TBI full analysis,charts,indicators,moving averages,SMA,DMA,EMA,ADX,MACD,RSITrueblue Inc TBI WideScreen charts, DMA,SMA,EMA technical analysis, forecast prediction, by indicators ADX,MACD,RSI,CCI USA stock exchange
operates under Technology sector & deals in Professional Services
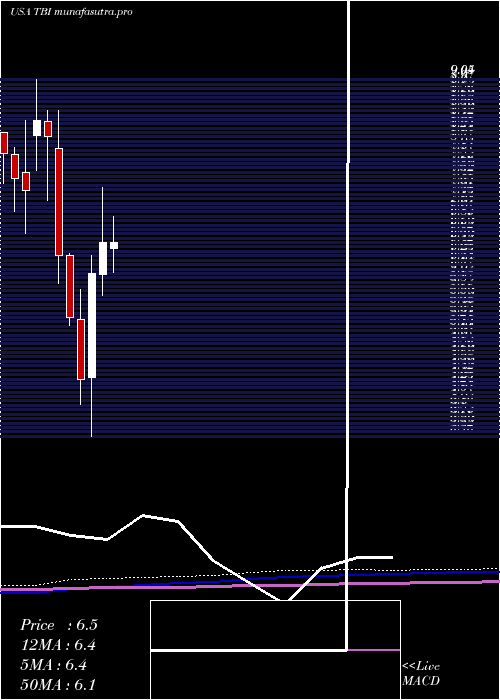
Daily price and charts and targets TrueblueInc Strong Daily Stock price targets for TrueblueInc TBI are 4.84 and 4.96 | Daily Target 1 | 4.82 | | Daily Target 2 | 4.86 | | Daily Target 3 | 4.94 | | Daily Target 4 | 4.98 | | Daily Target 5 | 5.06 |
Daily price and volume Trueblue Inc
| Date |
Closing |
Open |
Range |
Volume |
Fri 05 December 2025 |
4.90 (-1.8%) |
5.01 |
4.90 - 5.02 |
0.7155 times |
Thu 04 December 2025 |
4.99 (-3.48%) |
5.18 |
4.89 - 5.25 |
1.3103 times |
Wed 03 December 2025 |
5.17 (1.77%) |
5.15 |
5.12 - 5.25 |
0.8262 times |
Tue 02 December 2025 |
5.08 (-1.36%) |
5.20 |
5.05 - 5.39 |
1.5011 times |
Mon 01 December 2025 |
5.15 (5.1%) |
4.84 |
4.84 - 5.17 |
1.1343 times |
Fri 28 November 2025 |
4.90 (-2.39%) |
5.06 |
4.89 - 5.07 |
0.5481 times |
Wed 26 November 2025 |
5.02 (-0.2%) |
5.00 |
4.99 - 5.07 |
0.7422 times |
Tue 25 November 2025 |
5.03 (5.89%) |
4.77 |
4.77 - 5.05 |
0.9609 times |
Mon 24 November 2025 |
4.75 (0.21%) |
4.64 |
4.52 - 4.84 |
1.0643 times |
Fri 21 November 2025 |
4.74 (5.33%) |
4.53 |
4.45 - 4.85 |
1.197 times |
Thu 20 November 2025 |
4.50 (-1.53%) |
4.61 |
4.47 - 4.69 |
0.8829 times |
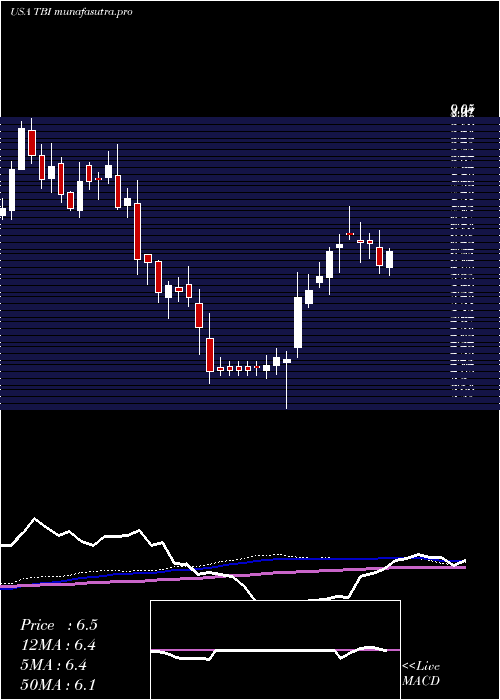
Weekly price and charts TrueblueInc Strong weekly Stock price targets for TrueblueInc TBI are 4.87 and 5.42 | Weekly Target 1 | 4.49 | | Weekly Target 2 | 4.7 | | Weekly Target 3 | 5.0433333333333 | | Weekly Target 4 | 5.25 | | Weekly Target 5 | 5.59 |
Weekly price and volumes for Trueblue Inc
| Date |
Closing |
Open |
Range |
Volume |
Fri 05 December 2025 |
4.90 (0%) |
4.84 |
4.84 - 5.39 |
0.8741 times |
Fri 28 November 2025 |
4.90 (3.38%) |
4.64 |
4.52 - 5.07 |
0.5282 times |
Fri 21 November 2025 |
4.74 (-3.46%) |
4.96 |
4.45 - 5.04 |
0.8049 times |
Fri 14 November 2025 |
4.91 (0%) |
4.98 |
4.76 - 5.36 |
0.8903 times |
Fri 07 November 2025 |
4.91 (3.59%) |
4.81 |
4.74 - 5.84 |
1.6918 times |
Fri 31 October 2025 |
4.74 (0%) |
4.83 |
4.72 - 4.88 |
0.2539 times |
Fri 31 October 2025 |
4.74 (-19.93%) |
5.97 |
4.72 - 5.98 |
1.0299 times |
Fri 24 October 2025 |
5.92 (9.83%) |
5.47 |
5.29 - 5.93 |
1.7315 times |
Fri 17 October 2025 |
5.39 (-9.26%) |
5.62 |
5.28 - 5.63 |
1.7046 times |
Tue 07 October 2025 |
5.94 (-1.98%) |
6.07 |
5.73 - 6.11 |
0.4909 times |
Fri 03 October 2025 |
6.06 (-2.88%) |
6.26 |
5.62 - 6.51 |
1.1446 times |
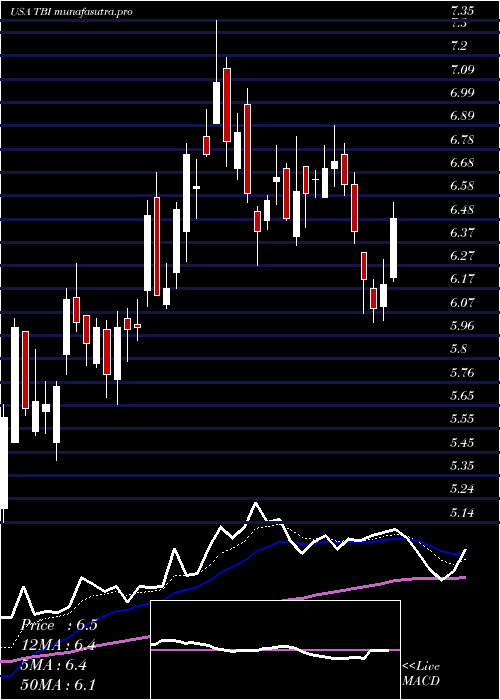
Monthly price and charts TrueblueInc Strong monthly Stock price targets for TrueblueInc TBI are 4.87 and 5.42 | Monthly Target 1 | 4.49 | | Monthly Target 2 | 4.7 | | Monthly Target 3 | 5.0433333333333 | | Monthly Target 4 | 5.25 | | Monthly Target 5 | 5.59 |
Monthly price and volumes Trueblue Inc
| Date |
Closing |
Open |
Range |
Volume |
Fri 05 December 2025 |
4.90 (0%) |
4.84 |
4.84 - 5.39 |
0.1759 times |
Fri 28 November 2025 |
4.90 (3.38%) |
4.81 |
4.45 - 5.84 |
0.7876 times |
Fri 31 October 2025 |
4.74 (-22.68%) |
6.00 |
4.72 - 6.51 |
1.1884 times |
Tue 30 September 2025 |
6.13 (2.68%) |
5.89 |
5.41 - 6.66 |
0.7714 times |
Fri 29 August 2025 |
5.97 (-17.31%) |
7.07 |
5.36 - 7.08 |
0.796 times |
Thu 31 July 2025 |
7.22 (11.42%) |
6.40 |
6.02 - 7.78 |
0.8597 times |
Mon 30 June 2025 |
6.48 (8%) |
5.99 |
5.66 - 7.35 |
0.9598 times |
Fri 30 May 2025 |
6.00 (38.25%) |
4.37 |
3.45 - 6.28 |
2.2734 times |
Wed 30 April 2025 |
4.34 (-18.27%) |
5.28 |
3.95 - 5.75 |
1.2352 times |
Mon 31 March 2025 |
5.31 (-15.45%) |
6.29 |
5.19 - 6.32 |
0.9525 times |
Fri 28 February 2025 |
6.28 (-22.94%) |
7.96 |
5.85 - 8.55 |
0.769 times |
DMA SMA EMA moving averages of Trueblue Inc TBI
DMA (daily moving average) of Trueblue Inc TBI
| DMA period | DMA value | | 5 day DMA | 5.06 | | 12 day DMA | 4.9 | | 20 day DMA | 4.92 | | 35 day DMA | 5.1 | | 50 day DMA | 5.35 | | 100 day DMA | 5.82 | | 150 day DMA | 5.83 | | 200 day DMA | 5.7 | EMA (exponential moving average) of Trueblue Inc TBI
| EMA period | EMA current | EMA prev | EMA prev2 | | 5 day EMA | 4.99 | 5.04 | 5.06 | | 12 day EMA | 4.97 | 4.98 | 4.98 | | 20 day EMA | 5.01 | 5.02 | 5.02 | | 35 day EMA | 5.19 | 5.21 | 5.22 | | 50 day EMA | 5.41 | 5.43 | 5.45 |
SMA (simple moving average) of Trueblue Inc TBI
| SMA period | SMA current | SMA prev | SMA prev2 | | 5 day SMA | 5.06 | 5.06 | 5.06 | | 12 day SMA | 4.9 | 4.88 | 4.87 | | 20 day SMA | 4.92 | 4.92 | 4.93 | | 35 day SMA | 5.1 | 5.11 | 5.13 | | 50 day SMA | 5.35 | 5.39 | 5.41 | | 100 day SMA | 5.82 | 5.84 | 5.85 | | 150 day SMA | 5.83 | 5.83 | 5.82 | | 200 day SMA | 5.7 | 5.71 | 5.72 |
|
|
