BancorpInc TBBK full analysis,charts,indicators,moving averages,SMA,DMA,EMA,ADX,MACD,RSIBancorp Inc TBBK WideScreen charts, DMA,SMA,EMA technical analysis, forecast prediction, by indicators ADX,MACD,RSI,CCI USA stock exchange
operates under Finance sector & deals in Major Banks
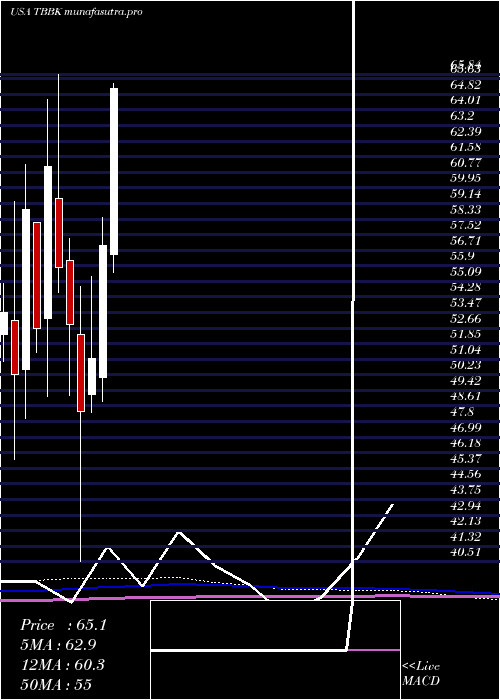
Daily price and charts and targets BancorpInc Strong Daily Stock price targets for BancorpInc TBBK are 72.75 and 75.13 | Daily Target 1 | 70.84 | | Daily Target 2 | 72.27 | | Daily Target 3 | 73.22 | | Daily Target 4 | 74.65 | | Daily Target 5 | 75.6 |
Daily price and volume Bancorp Inc
| Date |
Closing |
Open |
Range |
Volume |
Mon 20 October 2025 |
73.70 (3.16%) |
71.99 |
71.79 - 74.17 |
0.8065 times |
Fri 17 October 2025 |
71.44 (-0.33%) |
72.75 |
71.38 - 73.27 |
1.7545 times |
Thu 16 October 2025 |
71.68 (-8.24%) |
77.54 |
70.89 - 78.11 |
1.3083 times |
Wed 15 October 2025 |
78.12 (-2.76%) |
80.60 |
77.72 - 81.65 |
1.2584 times |
Tue 14 October 2025 |
80.34 (5.21%) |
75.25 |
75.00 - 81.25 |
1.1319 times |
Mon 13 October 2025 |
76.36 (5.24%) |
74.19 |
74.19 - 76.40 |
0.6737 times |
Fri 10 October 2025 |
72.56 (-5.58%) |
77.00 |
72.41 - 77.64 |
1.0749 times |
Thu 09 October 2025 |
76.85 (0.3%) |
76.50 |
75.89 - 77.22 |
0.6305 times |
Wed 08 October 2025 |
76.62 (0.24%) |
76.76 |
76.24 - 77.74 |
0.6372 times |
Tue 07 October 2025 |
76.44 (-2.56%) |
78.58 |
76.37 - 79.37 |
0.7242 times |
Mon 06 October 2025 |
78.45 (3.03%) |
76.58 |
75.95 - 78.83 |
1.1223 times |
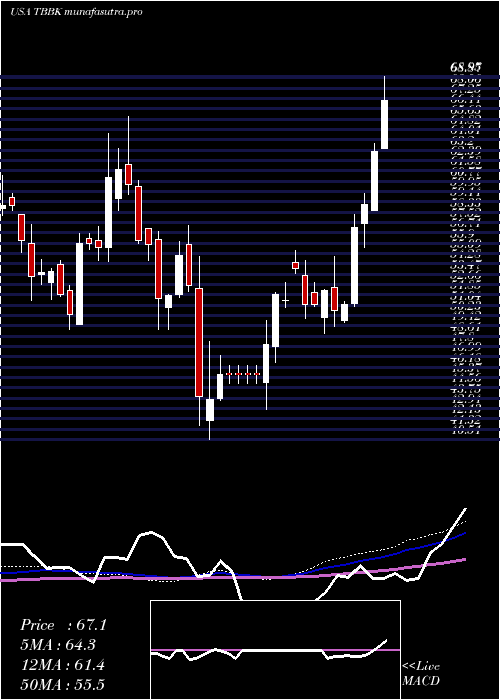
Weekly price and charts BancorpInc Strong weekly Stock price targets for BancorpInc TBBK are 72.75 and 75.13 | Weekly Target 1 | 70.84 | | Weekly Target 2 | 72.27 | | Weekly Target 3 | 73.22 | | Weekly Target 4 | 74.65 | | Weekly Target 5 | 75.6 |
Weekly price and volumes for Bancorp Inc
| Date |
Closing |
Open |
Range |
Volume |
Mon 20 October 2025 |
73.70 (3.16%) |
71.99 |
71.79 - 74.17 |
0.1889 times |
Fri 17 October 2025 |
71.44 (-1.54%) |
74.19 |
70.89 - 81.65 |
1.435 times |
Fri 10 October 2025 |
72.56 (-4.7%) |
76.58 |
72.41 - 79.37 |
0.9811 times |
Fri 03 October 2025 |
76.14 (-1.53%) |
77.80 |
71.31 - 78.09 |
1.1184 times |
Fri 26 September 2025 |
77.32 (-0.96%) |
77.65 |
75.50 - 80.76 |
0.9847 times |
Fri 19 September 2025 |
78.07 (2.79%) |
76.59 |
74.68 - 80.18 |
1.5854 times |
Fri 12 September 2025 |
75.95 (0.2%) |
76.02 |
75.00 - 77.40 |
1.145 times |
Fri 05 September 2025 |
75.80 (-0.58%) |
75.21 |
74.23 - 80.16 |
0.8189 times |
Fri 29 August 2025 |
76.24 (0%) |
78.15 |
76.05 - 78.50 |
0.1949 times |
Fri 29 August 2025 |
76.24 (4.83%) |
72.50 |
72.33 - 78.50 |
1.5477 times |
Fri 22 August 2025 |
72.73 (10.01%) |
65.85 |
64.77 - 72.87 |
1.3968 times |
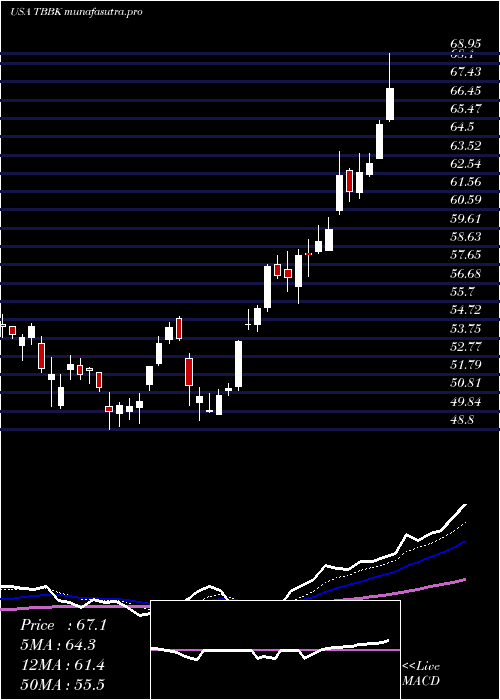
Monthly price and charts BancorpInc Strong monthly Stock price targets for BancorpInc TBBK are 66.92 and 77.68 | Monthly Target 1 | 64.65 | | Monthly Target 2 | 69.18 | | Monthly Target 3 | 75.413333333333 | | Monthly Target 4 | 79.94 | | Monthly Target 5 | 86.17 |
Monthly price and volumes Bancorp Inc
| Date |
Closing |
Open |
Range |
Volume |
Mon 20 October 2025 |
73.70 (-1.59%) |
74.43 |
70.89 - 81.65 |
0.6635 times |
Tue 30 September 2025 |
74.89 (-1.77%) |
75.21 |
71.31 - 80.76 |
1.1139 times |
Fri 29 August 2025 |
76.24 (20.71%) |
61.85 |
59.53 - 78.50 |
1.1988 times |
Thu 31 July 2025 |
63.16 (10.87%) |
56.50 |
55.58 - 70.63 |
1.6682 times |
Mon 30 June 2025 |
56.97 (11.49%) |
50.09 |
48.86 - 58.39 |
0.8587 times |
Fri 30 May 2025 |
51.10 (5.78%) |
49.21 |
48.28 - 55.33 |
0.6206 times |
Wed 30 April 2025 |
48.31 (-8.57%) |
52.32 |
40.51 - 54.84 |
1.3185 times |
Mon 31 March 2025 |
52.84 (-5.34%) |
56.16 |
49.15 - 57.31 |
0.9437 times |
Fri 28 February 2025 |
55.82 (-8.58%) |
59.41 |
54.51 - 65.84 |
0.7749 times |
Fri 31 January 2025 |
61.06 (16.02%) |
53.18 |
49.13 - 64.53 |
0.8394 times |
Tue 31 December 2024 |
52.63 (-10.54%) |
58.15 |
51.40 - 58.15 |
0.5773 times |
DMA SMA EMA moving averages of Bancorp Inc TBBK
DMA (daily moving average) of Bancorp Inc TBBK
| DMA period | DMA value | | 5 day DMA | 75.06 | | 12 day DMA | 75.73 | | 20 day DMA | 75.88 | | 35 day DMA | 76.24 | | 50 day DMA | 74.65 | | 100 day DMA | 66.88 | | 150 day DMA | 61.21 | | 200 day DMA | 59.87 | EMA (exponential moving average) of Bancorp Inc TBBK
| EMA period | EMA current | EMA prev | EMA prev2 | | 5 day EMA | 74.03 | 74.19 | 75.57 | | 12 day EMA | 75.1 | 75.35 | 76.06 | | 20 day EMA | 75.38 | 75.56 | 75.99 | | 35 day EMA | 74.57 | 74.62 | 74.81 | | 50 day EMA | 73.75 | 73.75 | 73.84 |
SMA (simple moving average) of Bancorp Inc TBBK
| SMA period | SMA current | SMA prev | SMA prev2 | | 5 day SMA | 75.06 | 75.59 | 75.81 | | 12 day SMA | 75.73 | 75.8 | 75.99 | | 20 day SMA | 75.88 | 76.13 | 76.46 | | 35 day SMA | 76.24 | 76.31 | 76.45 | | 50 day SMA | 74.65 | 74.46 | 74.29 | | 100 day SMA | 66.88 | 66.67 | 66.46 | | 150 day SMA | 61.21 | 61.06 | 60.93 | | 200 day SMA | 59.87 | 59.76 | 59.66 |
|
|
