AtT TBB full analysis,charts,indicators,moving averages,SMA,DMA,EMA,ADX,MACD,RSIAt T TBB WideScreen charts, DMA,SMA,EMA technical analysis, forecast prediction, by indicators ADX,MACD,RSI,CCI USA stock exchange
operates under Public Utilities sector & deals in Telecommunications Equipment
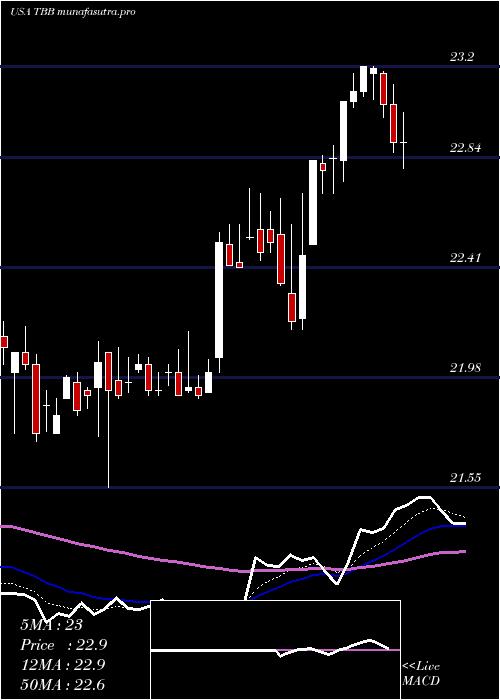
Daily price and charts and targets AtT Strong Daily Stock price targets for AtT TBB are 23.39 and 23.68 | Daily Target 1 | 23.15 | | Daily Target 2 | 23.34 | | Daily Target 3 | 23.44 | | Daily Target 4 | 23.63 | | Daily Target 5 | 23.73 |
Daily price and volume At T
| Date |
Closing |
Open |
Range |
Volume |
Mon 20 October 2025 |
23.53 (1.34%) |
23.27 |
23.25 - 23.54 |
1.2926 times |
Fri 17 October 2025 |
23.22 (-0.51%) |
23.13 |
23.02 - 23.24 |
2.1536 times |
Thu 16 October 2025 |
23.34 (0%) |
23.40 |
23.33 - 23.45 |
0.962 times |
Wed 15 October 2025 |
23.34 (0.3%) |
23.32 |
23.28 - 23.44 |
0.7542 times |
Tue 14 October 2025 |
23.27 (0.22%) |
23.22 |
23.12 - 23.36 |
0.7205 times |
Mon 13 October 2025 |
23.22 (0.48%) |
23.18 |
23.16 - 23.29 |
0.4612 times |
Fri 10 October 2025 |
23.11 (-0.64%) |
23.28 |
23.06 - 23.35 |
0.8907 times |
Thu 09 October 2025 |
23.26 (-0.39%) |
23.32 |
23.18 - 23.35 |
0.9778 times |
Wed 08 October 2025 |
23.35 (0%) |
23.39 |
23.33 - 23.43 |
0.8709 times |
Tue 07 October 2025 |
23.35 (-0.21%) |
23.40 |
23.31 - 23.50 |
0.9165 times |
Mon 06 October 2025 |
23.40 (0%) |
23.41 |
23.31 - 23.46 |
0.3945 times |
Weekly price and charts AtT Strong weekly Stock price targets for AtT TBB are 23.39 and 23.68 | Weekly Target 1 | 23.15 | | Weekly Target 2 | 23.34 | | Weekly Target 3 | 23.44 | | Weekly Target 4 | 23.63 | | Weekly Target 5 | 23.73 |
Weekly price and volumes for At T
| Date |
Closing |
Open |
Range |
Volume |
Mon 20 October 2025 |
23.53 (1.34%) |
23.27 |
23.25 - 23.54 |
0.2381 times |
Fri 17 October 2025 |
23.22 (0.48%) |
23.18 |
23.02 - 23.45 |
0.9304 times |
Fri 10 October 2025 |
23.11 (-1.24%) |
23.41 |
23.06 - 23.50 |
0.746 times |
Fri 03 October 2025 |
23.40 (0.52%) |
23.31 |
22.92 - 23.51 |
1.2293 times |
Fri 26 September 2025 |
23.28 (-1.81%) |
23.71 |
23.22 - 23.78 |
0.8421 times |
Fri 19 September 2025 |
23.71 (-0.71%) |
23.94 |
23.61 - 24.10 |
1.0948 times |
Fri 12 September 2025 |
23.88 (3.06%) |
23.25 |
23.13 - 23.91 |
1.0594 times |
Fri 05 September 2025 |
23.17 (2.66%) |
22.52 |
22.50 - 23.17 |
0.911 times |
Fri 29 August 2025 |
22.57 (0%) |
22.92 |
22.49 - 22.95 |
1.101 times |
Fri 29 August 2025 |
22.57 (-3.38%) |
23.34 |
22.49 - 23.37 |
1.848 times |
Fri 22 August 2025 |
23.36 (1.3%) |
23.09 |
23.01 - 23.43 |
0.9756 times |
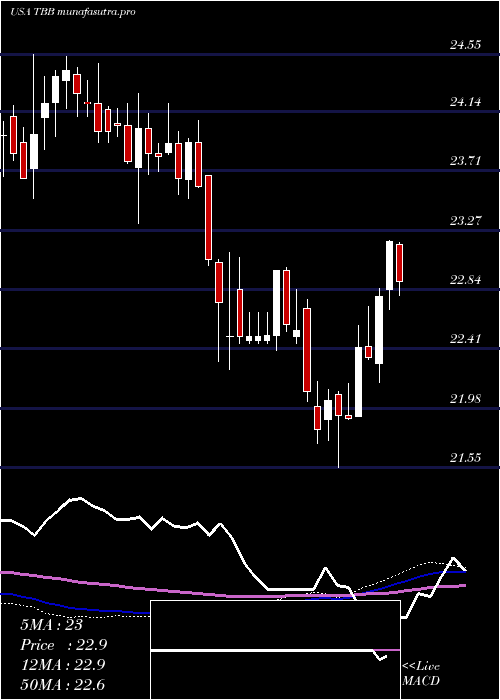
Monthly price and charts AtT Strong monthly Stock price targets for AtT TBB are 23.28 and 23.8 | Monthly Target 1 | 22.84 | | Monthly Target 2 | 23.19 | | Monthly Target 3 | 23.363333333333 | | Monthly Target 4 | 23.71 | | Monthly Target 5 | 23.88 |
Monthly price and volumes At T
| Date |
Closing |
Open |
Range |
Volume |
Mon 20 October 2025 |
23.53 (2.08%) |
23.11 |
23.02 - 23.54 |
0.451 times |
Tue 30 September 2025 |
23.05 (2.13%) |
22.52 |
22.50 - 24.10 |
0.8471 times |
Fri 29 August 2025 |
22.57 (-2.63%) |
23.17 |
22.49 - 23.43 |
1.1423 times |
Thu 31 July 2025 |
23.18 (4.41%) |
22.21 |
22.17 - 23.20 |
0.9144 times |
Mon 30 June 2025 |
22.20 (0.73%) |
22.08 |
21.55 - 22.72 |
0.9585 times |
Fri 30 May 2025 |
22.04 (-2.86%) |
22.92 |
21.73 - 23.00 |
1.3296 times |
Wed 30 April 2025 |
22.69 (-0.26%) |
22.83 |
22.26 - 23.11 |
0.9785 times |
Mon 31 March 2025 |
22.75 (-4.81%) |
23.90 |
22.69 - 24.07 |
1.0257 times |
Fri 28 February 2025 |
23.90 (0.55%) |
23.73 |
23.32 - 24.26 |
0.6998 times |
Fri 31 January 2025 |
23.77 (-2.62%) |
24.39 |
23.76 - 24.53 |
1.6531 times |
Tue 31 December 2024 |
24.41 (2.43%) |
23.65 |
23.50 - 24.55 |
2.3319 times |

DMA SMA EMA moving averages of At T TBB
DMA (daily moving average) of At T TBB
| DMA period | DMA value | | 5 day DMA | 23.34 | | 12 day DMA | 23.32 | | 20 day DMA | 23.34 | | 35 day DMA | 23.4 | | 50 day DMA | 23.3 | | 100 day DMA | 22.9 | | 150 day DMA | 22.83 | | 200 day DMA | 23.11 | EMA (exponential moving average) of At T TBB
| EMA period | EMA current | EMA prev | EMA prev2 | | 5 day EMA | 23.36 | 23.28 | 23.31 | | 12 day EMA | 23.34 | 23.3 | 23.31 | | 20 day EMA | 23.35 | 23.33 | 23.34 | | 35 day EMA | 23.28 | 23.27 | 23.27 | | 50 day EMA | 23.25 | 23.24 | 23.24 |
SMA (simple moving average) of At T TBB
| SMA period | SMA current | SMA prev | SMA prev2 | | 5 day SMA | 23.34 | 23.28 | 23.26 | | 12 day SMA | 23.32 | 23.31 | 23.33 | | 20 day SMA | 23.34 | 23.34 | 23.37 | | 35 day SMA | 23.4 | 23.37 | 23.35 | | 50 day SMA | 23.3 | 23.28 | 23.27 | | 100 day SMA | 22.9 | 22.88 | 22.87 | | 150 day SMA | 22.83 | 22.83 | 22.83 | | 200 day SMA | 23.11 | 23.11 | 23.12 |
|
|
