TatTechnologies TATT full analysis,charts,indicators,moving averages,SMA,DMA,EMA,ADX,MACD,RSITat Technologies TATT WideScreen charts, DMA,SMA,EMA technical analysis, forecast prediction, by indicators ADX,MACD,RSI,CCI USA stock exchange
operates under Capital Goods sector & deals in Aerospace
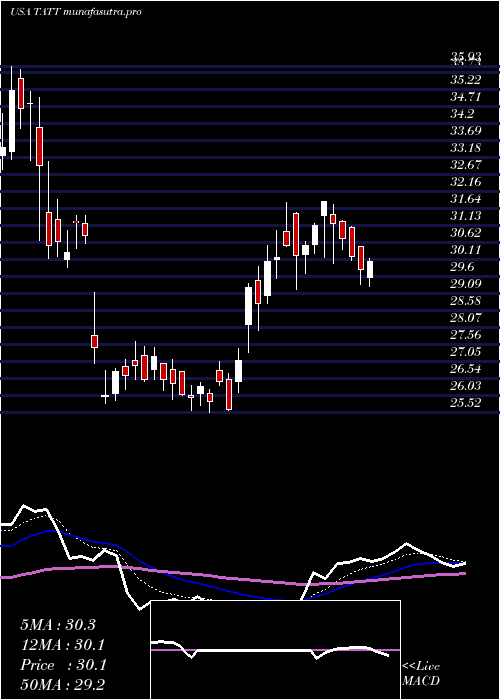
Daily price and charts and targets TatTechnologies Strong Daily Stock price targets for TatTechnologies TATT are 39.75 and 42.13 | Daily Target 1 | 38.04 | | Daily Target 2 | 39.08 | | Daily Target 3 | 40.42 | | Daily Target 4 | 41.46 | | Daily Target 5 | 42.8 |
Daily price and volume Tat Technologies
| Date |
Closing |
Open |
Range |
Volume |
Thu 04 December 2025 |
40.12 (-0.22%) |
39.79 |
39.38 - 41.76 |
0.9599 times |
Wed 03 December 2025 |
40.21 (-1.06%) |
39.91 |
39.70 - 40.72 |
0.3227 times |
Tue 02 December 2025 |
40.64 (4.18%) |
39.37 |
39.05 - 41.19 |
0.8402 times |
Mon 01 December 2025 |
39.01 (1.54%) |
37.53 |
37.04 - 39.74 |
1.057 times |
Fri 28 November 2025 |
38.42 (0.47%) |
38.65 |
37.89 - 39.00 |
0.1248 times |
Wed 26 November 2025 |
38.24 (5.99%) |
36.80 |
36.65 - 39.42 |
1.4156 times |
Tue 25 November 2025 |
36.08 (-8.73%) |
38.69 |
35.88 - 38.82 |
1.6066 times |
Mon 24 November 2025 |
39.53 (0.74%) |
39.15 |
37.50 - 41.70 |
1.5681 times |
Fri 21 November 2025 |
39.24 (1.98%) |
38.01 |
37.25 - 39.70 |
1.333 times |
Thu 20 November 2025 |
38.48 (-0.59%) |
39.51 |
37.61 - 40.21 |
0.7721 times |
Wed 19 November 2025 |
38.71 (-1.05%) |
39.38 |
38.32 - 39.55 |
0.3675 times |
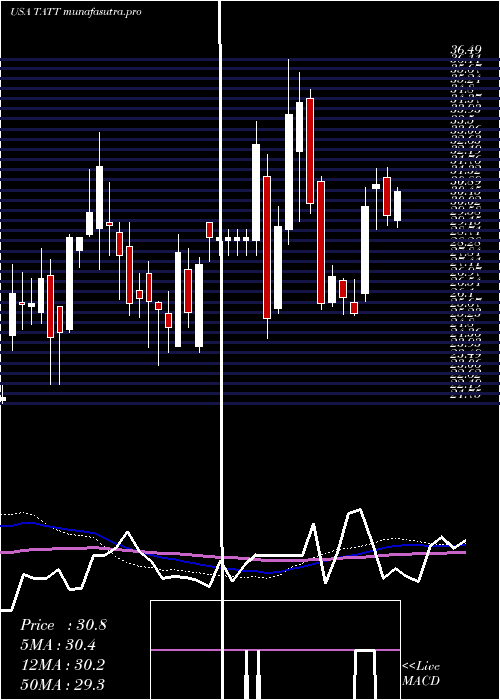
Weekly price and charts TatTechnologies Strong weekly Stock price targets for TatTechnologies TATT are 38.58 and 43.3 | Weekly Target 1 | 34.92 | | Weekly Target 2 | 37.52 | | Weekly Target 3 | 39.64 | | Weekly Target 4 | 42.24 | | Weekly Target 5 | 44.36 |
Weekly price and volumes for Tat Technologies
| Date |
Closing |
Open |
Range |
Volume |
Thu 04 December 2025 |
40.12 (4.42%) |
37.53 |
37.04 - 41.76 |
0.8605 times |
Fri 28 November 2025 |
38.42 (-2.09%) |
39.15 |
35.88 - 41.70 |
1.276 times |
Fri 21 November 2025 |
39.24 (-2%) |
40.32 |
37.25 - 41.33 |
1.1818 times |
Fri 14 November 2025 |
40.04 (2.88%) |
40.15 |
37.71 - 43.55 |
1.0222 times |
Fri 07 November 2025 |
38.92 (-7.33%) |
40.43 |
34.54 - 41.47 |
1.0409 times |
Fri 31 October 2025 |
42.00 (0%) |
42.11 |
41.78 - 44.68 |
0.1312 times |
Fri 31 October 2025 |
42.00 (0.74%) |
42.00 |
41.50 - 45.83 |
1.592 times |
Fri 24 October 2025 |
41.69 (7.28%) |
39.06 |
38.12 - 42.60 |
1.2091 times |
Fri 17 October 2025 |
38.86 (-7.28%) |
42.04 |
38.32 - 44.31 |
0.8122 times |
Fri 10 October 2025 |
41.91 (-0.8%) |
42.99 |
41.10 - 45.40 |
0.8741 times |
Fri 03 October 2025 |
42.25 (5.57%) |
40.29 |
40.00 - 45.00 |
1.0837 times |
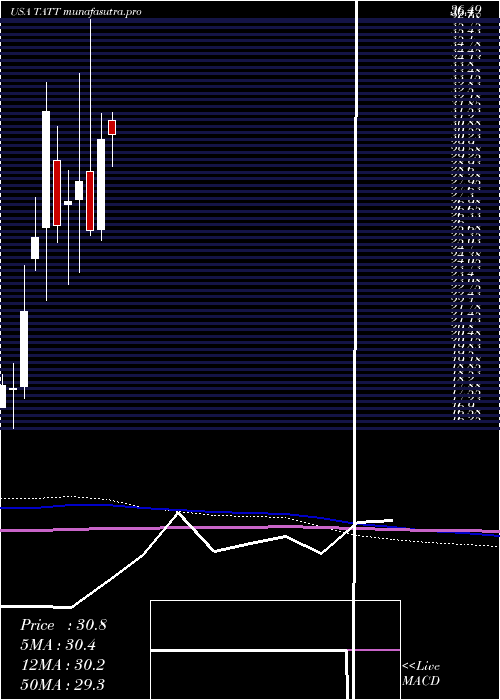
Monthly price and charts TatTechnologies Strong monthly Stock price targets for TatTechnologies TATT are 38.58 and 43.3 | Monthly Target 1 | 34.92 | | Monthly Target 2 | 37.52 | | Monthly Target 3 | 39.64 | | Monthly Target 4 | 42.24 | | Monthly Target 5 | 44.36 |
Monthly price and volumes Tat Technologies
| Date |
Closing |
Open |
Range |
Volume |
Thu 04 December 2025 |
40.12 (4.42%) |
37.53 |
37.04 - 41.76 |
0.1655 times |
Fri 28 November 2025 |
38.42 (-8.52%) |
40.43 |
34.54 - 43.55 |
0.8696 times |
Fri 31 October 2025 |
42.00 (-4.61%) |
44.93 |
38.12 - 45.83 |
0.9981 times |
Tue 30 September 2025 |
44.03 (20.8%) |
35.69 |
32.75 - 44.13 |
1.0628 times |
Fri 29 August 2025 |
36.45 (5.74%) |
33.84 |
30.36 - 41.00 |
1.5159 times |
Thu 31 July 2025 |
34.47 (12.87%) |
31.50 |
29.22 - 36.99 |
0.8555 times |
Mon 30 June 2025 |
30.54 (17.33%) |
26.08 |
25.52 - 31.82 |
1.576 times |
Fri 30 May 2025 |
26.03 (-8.54%) |
28.96 |
25.78 - 36.49 |
1.6534 times |
Wed 30 April 2025 |
28.46 (3.57%) |
27.58 |
23.96 - 33.82 |
1.002 times |
Mon 31 March 2025 |
27.48 (4.65%) |
27.31 |
23.37 - 29.00 |
0.3012 times |
Fri 28 February 2025 |
26.26 (-17.71%) |
29.50 |
25.45 - 31.20 |
0.289 times |
DMA SMA EMA moving averages of Tat Technologies TATT
DMA (daily moving average) of Tat Technologies TATT
| DMA period | DMA value | | 5 day DMA | 39.68 | | 12 day DMA | 38.98 | | 20 day DMA | 39.1 | | 35 day DMA | 40.06 | | 50 day DMA | 40.8 | | 100 day DMA | 38.4 | | 150 day DMA | 35.52 | | 200 day DMA | 33.36 | EMA (exponential moving average) of Tat Technologies TATT
| EMA period | EMA current | EMA prev | EMA prev2 | | 5 day EMA | 39.75 | 39.56 | 39.23 | | 12 day EMA | 39.39 | 39.26 | 39.09 | | 20 day EMA | 39.53 | 39.47 | 39.39 | | 35 day EMA | 40.02 | 40.01 | 40 | | 50 day EMA | 40.75 | 40.78 | 40.8 |
SMA (simple moving average) of Tat Technologies TATT
| SMA period | SMA current | SMA prev | SMA prev2 | | 5 day SMA | 39.68 | 39.3 | 38.48 | | 12 day SMA | 38.98 | 38.87 | 38.86 | | 20 day SMA | 39.1 | 39.12 | 39.12 | | 35 day SMA | 40.06 | 40.12 | 40.19 | | 50 day SMA | 40.8 | 40.81 | 40.83 | | 100 day SMA | 38.4 | 38.3 | 38.2 | | 150 day SMA | 35.52 | 35.44 | 35.36 | | 200 day SMA | 33.36 | 33.29 | 33.23 |
|
|
