MolsonCoors TAP.A full analysis,charts,indicators,moving averages,SMA,DMA,EMA,ADX,MACD,RSIMolson Coors TAP.A WideScreen charts, DMA,SMA,EMA technical analysis, forecast prediction, by indicators ADX,MACD,RSI,CCI USA stock exchange
operates under N A sector & deals in N A
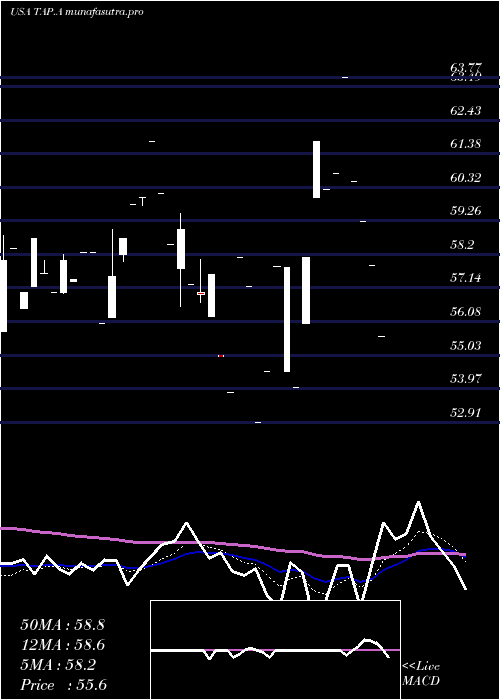
Daily price and charts and targets MolsonCoors Strong Daily Stock price targets for MolsonCoors TAP.A are 55.6 and 55.6 | Daily Target 1 | 55.6 | | Daily Target 2 | 55.6 | | Daily Target 3 | 55.6 | | Daily Target 4 | 55.6 | | Daily Target 5 | 55.6 |
Daily price and volume Molson Coors
| Date |
Closing |
Open |
Range |
Volume |
Fri 23 May 2025 |
55.60 (-3.87%) |
55.60 |
55.60 - 55.60 |
0.9573 times |
Tue 06 May 2025 |
57.84 (-2.36%) |
57.84 |
57.84 - 57.84 |
0.5744 times |
Fri 28 March 2025 |
59.24 (-2.08%) |
59.24 |
59.24 - 59.24 |
0.1915 times |
Wed 26 March 2025 |
60.50 (-5.13%) |
60.50 |
60.50 - 60.50 |
0.1915 times |
Wed 05 March 2025 |
63.77 (4.97%) |
63.77 |
63.77 - 63.77 |
0.2355 times |
Tue 04 March 2025 |
60.75 (0.83%) |
60.75 |
60.75 - 60.75 |
0.1915 times |
Mon 24 February 2025 |
60.25 (-2.44%) |
60.25 |
60.25 - 60.25 |
1.1488 times |
Fri 14 February 2025 |
61.76 (6.28%) |
60.00 |
60.00 - 61.76 |
0.9573 times |
Thu 13 February 2025 |
58.11 (7.61%) |
56.01 |
56.01 - 58.11 |
4.7865 times |
Wed 12 February 2025 |
54.00 (-6.56%) |
54.00 |
54.00 - 54.00 |
0.7658 times |
Tue 11 February 2025 |
57.79 (-0.03%) |
54.50 |
54.50 - 57.79 |
0.7658 times |
Weekly price and charts MolsonCoors Strong weekly Stock price targets for MolsonCoors TAP.A are 54.48 and 56.72 | Weekly Target 1 | 54.11 | | Weekly Target 2 | 54.85 | | Weekly Target 3 | 56.346666666667 | | Weekly Target 4 | 57.09 | | Weekly Target 5 | 58.59 |
Weekly price and volumes for Molson Coors
| Date |
Closing |
Open |
Range |
Volume |
Fri 23 May 2025 |
55.60 (-6.14%) |
57.84 |
55.60 - 57.84 |
0.4928 times |
Fri 28 March 2025 |
59.24 (-7.1%) |
60.50 |
59.24 - 60.50 |
0.1232 times |
Wed 05 March 2025 |
63.77 (3.25%) |
60.25 |
60.25 - 63.77 |
0.507 times |
Fri 14 February 2025 |
61.76 (6.83%) |
54.50 |
54.00 - 61.76 |
2.3409 times |
Fri 07 February 2025 |
57.81 (1.07%) |
52.91 |
52.91 - 57.81 |
0.9856 times |
Fri 31 January 2025 |
57.20 (4%) |
53.86 |
53.86 - 58.11 |
0.5544 times |
Fri 10 January 2025 |
55.00 (-4.43%) |
55.01 |
55.00 - 55.01 |
0.2464 times |
Fri 03 January 2025 |
57.55 (-2.44%) |
57.26 |
56.25 - 58.05 |
1.9898 times |
Fri 27 December 2024 |
58.99 (-4.49%) |
60.11 |
56.56 - 60.11 |
2.6526 times |
Wed 11 December 2024 |
61.76 (2.93%) |
61.76 |
61.76 - 61.76 |
0.1072 times |
Fri 08 November 2024 |
60.00 (2.23%) |
59.78 |
59.76 - 60.00 |
0.5544 times |
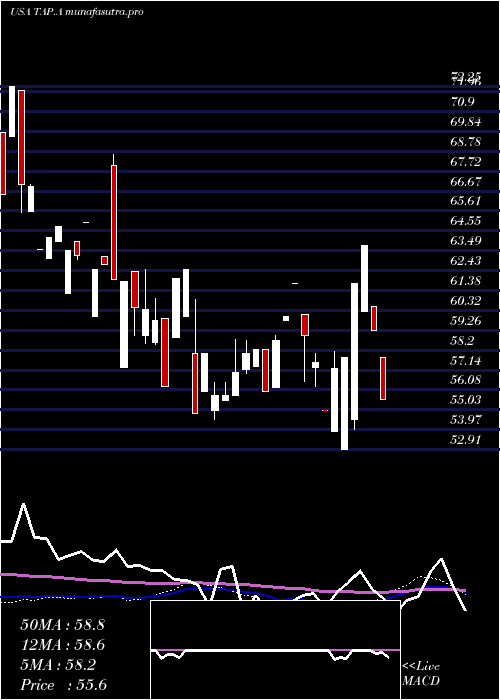
Monthly price and charts MolsonCoors Strong monthly Stock price targets for MolsonCoors TAP.A are 54.48 and 56.72 | Monthly Target 1 | 54.11 | | Monthly Target 2 | 54.85 | | Monthly Target 3 | 56.346666666667 | | Monthly Target 4 | 57.09 | | Monthly Target 5 | 58.59 |
Monthly price and volumes Molson Coors
| Date |
Closing |
Open |
Range |
Volume |
Fri 23 May 2025 |
55.60 (-6.14%) |
57.84 |
55.60 - 57.84 |
0.1838 times |
Fri 28 March 2025 |
59.24 (-1.68%) |
60.75 |
59.24 - 63.77 |
0.0972 times |
Mon 24 February 2025 |
60.25 (5.33%) |
52.91 |
52.91 - 61.76 |
1.3783 times |
Fri 31 January 2025 |
57.20 (-0.1%) |
57.00 |
53.86 - 58.11 |
0.9924 times |
Mon 30 December 2024 |
57.26 (-4.57%) |
61.76 |
56.56 - 61.76 |
1.0773 times |
Fri 08 November 2024 |
60.00 (4.35%) |
58.21 |
57.98 - 60.00 |
0.6202 times |
Tue 08 October 2024 |
57.50 (-1.3%) |
56.01 |
56.01 - 59.00 |
0.5283 times |
Mon 30 September 2024 |
58.26 (4.45%) |
55.77 |
55.77 - 58.79 |
2.1593 times |
Fri 30 August 2024 |
55.78 (-8.39%) |
54.81 |
54.51 - 58.00 |
1.8147 times |
Tue 23 July 2024 |
60.89 (3.41%) |
58.87 |
58.00 - 62.50 |
1.1486 times |
Mon 17 June 2024 |
58.88 (-2.48%) |
58.61 |
56.25 - 60.97 |
1.1026 times |

DMA SMA EMA moving averages of Molson Coors TAP.A
DMA (daily moving average) of Molson Coors TAP.A
| DMA period | DMA value | | 5 day DMA | 59.39 | | 12 day DMA | 58.95 | | 20 day DMA | 57.68 | | 35 day DMA | 58.03 | | 50 day DMA | 58.07 | | 100 day DMA | 60.95 | | 150 day DMA | 64.53 | | 200 day DMA | 65.07 | EMA (exponential moving average) of Molson Coors TAP.A
| EMA period | EMA current | EMA prev | EMA prev2 | | 5 day EMA | 58.18 | 59.47 | 60.28 | | 12 day EMA | 58.55 | 59.09 | 59.32 | | 20 day EMA | 58.36 | 58.65 | 58.74 | | 35 day EMA | 58.18 | 58.33 | 58.36 | | 50 day EMA | 58.23 | 58.34 | 58.36 |
SMA (simple moving average) of Molson Coors TAP.A
| SMA period | SMA current | SMA prev | SMA prev2 | | 5 day SMA | 59.39 | 60.42 | 60.9 | | 12 day SMA | 58.95 | 58.86 | 58.45 | | 20 day SMA | 57.68 | 57.76 | 57.82 | | 35 day SMA | 58.03 | 58.09 | 58.11 | | 50 day SMA | 58.07 | 58.16 | 58.18 | | 100 day SMA | 60.95 | 60.99 | 61.02 | | 150 day SMA | 64.53 | 64.65 | 64.73 | | 200 day SMA | 65.07 | 65.1 | 65.12 |
|
|
