TantechHoldings TANH full analysis,charts,indicators,moving averages,SMA,DMA,EMA,ADX,MACD,RSITantech Holdings TANH WideScreen charts, DMA,SMA,EMA technical analysis, forecast prediction, by indicators ADX,MACD,RSI,CCI USA stock exchange
operates under Basic Industries sector & deals in Major Chemicals
Daily price and charts and targets TantechHoldings Strong Daily Stock price targets for TantechHoldings TANH are 1.11 and 1.14 | Daily Target 1 | 1.08 | | Daily Target 2 | 1.1 | | Daily Target 3 | 1.11 | | Daily Target 4 | 1.13 | | Daily Target 5 | 1.14 |
Daily price and volume Tantech Holdings
| Date |
Closing |
Open |
Range |
Volume |
Thu 04 December 2025 |
1.12 (0%) |
1.12 |
1.09 - 1.12 |
0.2698 times |
Wed 03 December 2025 |
1.12 (0%) |
1.10 |
0.98 - 1.12 |
0.4787 times |
Tue 02 December 2025 |
1.12 (-0.88%) |
1.11 |
1.11 - 1.12 |
0.0555 times |
Mon 01 December 2025 |
1.13 (-5.04%) |
1.16 |
1.10 - 1.19 |
1.6238 times |
Fri 28 November 2025 |
1.19 (13.33%) |
1.07 |
1.06 - 1.20 |
1.6952 times |
Wed 26 November 2025 |
1.05 (0.96%) |
1.02 |
1.02 - 1.09 |
0.2989 times |
Tue 25 November 2025 |
1.04 (-2.8%) |
1.05 |
1.03 - 1.06 |
0.2962 times |
Mon 24 November 2025 |
1.07 (8.08%) |
1.02 |
1.00 - 1.07 |
0.7511 times |
Fri 21 November 2025 |
0.99 (0%) |
0.98 |
0.93 - 1.04 |
2.7033 times |
Thu 20 November 2025 |
0.99 (-1.98%) |
0.97 |
0.96 - 1.04 |
1.8275 times |
Wed 19 November 2025 |
1.01 (-0.98%) |
1.02 |
0.95 - 1.04 |
1.809 times |
Weekly price and charts TantechHoldings Strong weekly Stock price targets for TantechHoldings TANH are 0.95 and 1.16 | Weekly Target 1 | 0.89 | | Weekly Target 2 | 1 | | Weekly Target 3 | 1.0966666666667 | | Weekly Target 4 | 1.21 | | Weekly Target 5 | 1.31 |
Weekly price and volumes for Tantech Holdings
| Date |
Closing |
Open |
Range |
Volume |
Thu 04 December 2025 |
1.12 (-5.88%) |
1.16 |
0.98 - 1.19 |
0.182 times |
Fri 28 November 2025 |
1.19 (20.2%) |
1.02 |
1.00 - 1.20 |
0.228 times |
Fri 21 November 2025 |
0.99 (-11.61%) |
1.11 |
0.93 - 1.14 |
0.7948 times |
Fri 14 November 2025 |
1.12 (-2.61%) |
1.14 |
1.07 - 1.19 |
0.4851 times |
Fri 07 November 2025 |
1.15 (-15.44%) |
1.32 |
1.07 - 1.32 |
0.6486 times |
Fri 31 October 2025 |
1.36 (0%) |
1.40 |
1.21 - 1.40 |
0.2694 times |
Fri 31 October 2025 |
1.36 (-15%) |
1.63 |
1.21 - 1.63 |
0.9682 times |
Fri 24 October 2025 |
1.60 (-5.88%) |
1.69 |
1.54 - 1.77 |
0.8403 times |
Fri 17 October 2025 |
1.70 (8.97%) |
1.63 |
1.58 - 1.84 |
1.0479 times |
Fri 10 October 2025 |
1.56 (-13.33%) |
1.88 |
1.53 - 1.96 |
4.5356 times |
Fri 03 October 2025 |
1.80 (2.86%) |
1.76 |
1.62 - 1.89 |
0.9799 times |

Monthly price and charts TantechHoldings Strong monthly Stock price targets for TantechHoldings TANH are 0.95 and 1.16 | Monthly Target 1 | 0.89 | | Monthly Target 2 | 1 | | Monthly Target 3 | 1.0966666666667 | | Monthly Target 4 | 1.21 | | Monthly Target 5 | 1.31 |
Monthly price and volumes Tantech Holdings
| Date |
Closing |
Open |
Range |
Volume |
Thu 04 December 2025 |
1.12 (-5.88%) |
1.16 |
0.98 - 1.19 |
0.0171 times |
Fri 28 November 2025 |
1.19 (-12.5%) |
1.32 |
0.93 - 1.32 |
0.2023 times |
Fri 31 October 2025 |
1.36 (-18.07%) |
1.68 |
1.21 - 1.96 |
0.7595 times |
Tue 30 September 2025 |
1.66 (-17.82%) |
2.00 |
1.62 - 2.59 |
6.2988 times |
Fri 29 August 2025 |
2.02 (0.5%) |
2.01 |
1.72 - 2.12 |
0.1189 times |
Thu 31 July 2025 |
2.01 (2.55%) |
2.11 |
1.81 - 2.23 |
0.34 times |
Mon 30 June 2025 |
1.96 (-11.71%) |
2.10 |
1.93 - 2.26 |
0.1143 times |
Fri 30 May 2025 |
2.22 (13.27%) |
2.02 |
1.90 - 4.05 |
1.7938 times |
Wed 30 April 2025 |
1.96 (-6.22%) |
2.04 |
1.45 - 2.32 |
0.171 times |
Mon 31 March 2025 |
2.09 (-28.18%) |
3.00 |
2.00 - 3.13 |
0.1842 times |
Fri 28 February 2025 |
2.91 (1840%) |
0.15 |
0.08 - 4.64 |
7.3301 times |

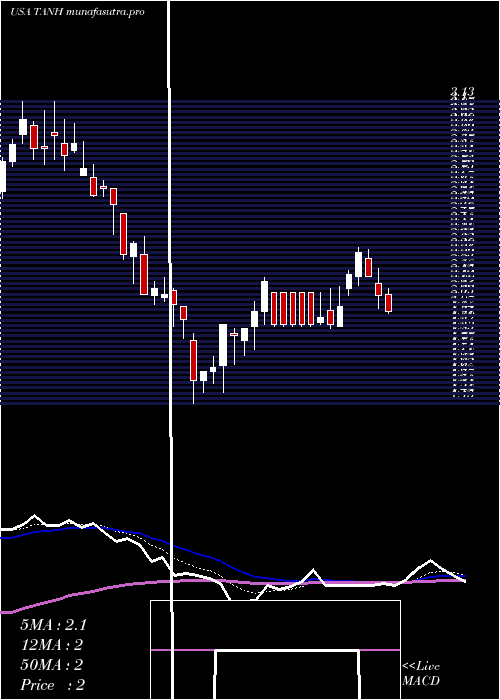
DMA SMA EMA moving averages of Tantech Holdings TANH
DMA (daily moving average) of Tantech Holdings TANH
| DMA period | DMA value | | 5 day DMA | 1.14 | | 12 day DMA | 1.07 | | 20 day DMA | 1.09 | | 35 day DMA | 1.28 | | 50 day DMA | 1.42 | | 100 day DMA | 1.7 | | 150 day DMA | 1.83 | | 200 day DMA | 1.96 | EMA (exponential moving average) of Tantech Holdings TANH
| EMA period | EMA current | EMA prev | EMA prev2 | | 5 day EMA | 1.11 | 1.11 | 1.11 | | 12 day EMA | 1.1 | 1.1 | 1.1 | | 20 day EMA | 1.17 | 1.17 | 1.17 | | 35 day EMA | 1.27 | 1.28 | 1.29 | | 50 day EMA | 1.46 | 1.47 | 1.48 |
SMA (simple moving average) of Tantech Holdings TANH
| SMA period | SMA current | SMA prev | SMA prev2 | | 5 day SMA | 1.14 | 1.12 | 1.11 | | 12 day SMA | 1.07 | 1.06 | 1.06 | | 20 day SMA | 1.09 | 1.09 | 1.1 | | 35 day SMA | 1.28 | 1.29 | 1.31 | | 50 day SMA | 1.42 | 1.44 | 1.45 | | 100 day SMA | 1.7 | 1.71 | 1.72 | | 150 day SMA | 1.83 | 1.83 | 1.84 | | 200 day SMA | 1.96 | 1.98 | 1.99 |
|
|
