TransactTechnologies TACT full analysis,charts,indicators,moving averages,SMA,DMA,EMA,ADX,MACD,RSITransact Technologies TACT WideScreen charts, DMA,SMA,EMA technical analysis, forecast prediction, by indicators ADX,MACD,RSI,CCI USA stock exchange
operates under Technology sector & deals in Computer Peripheral Equipment
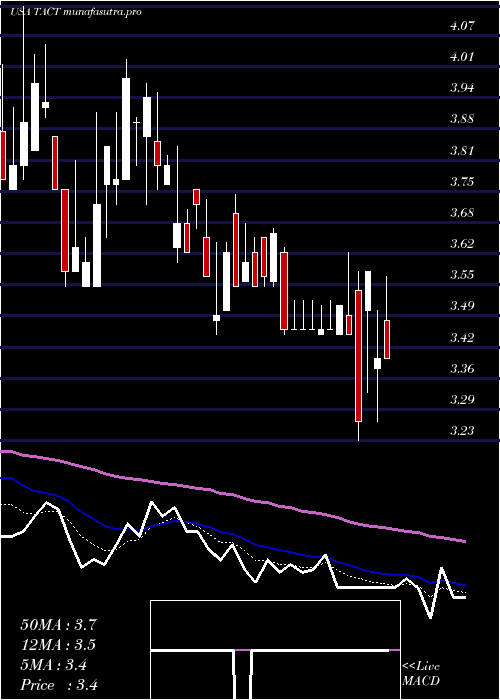
Daily price and charts and targets TransactTechnologies Strong Daily Stock price targets for TransactTechnologies TACT are 4.62 and 4.85 | Daily Target 1 | 4.46 | | Daily Target 2 | 4.55 | | Daily Target 3 | 4.6866666666667 | | Daily Target 4 | 4.78 | | Daily Target 5 | 4.92 |
Daily price and volume Transact Technologies
| Date |
Closing |
Open |
Range |
Volume |
Mon 20 October 2025 |
4.65 (0.87%) |
4.61 |
4.59 - 4.82 |
0.8217 times |
Fri 17 October 2025 |
4.61 (-3.56%) |
4.73 |
4.53 - 4.75 |
1.2872 times |
Thu 16 October 2025 |
4.78 (-5.35%) |
5.04 |
4.78 - 5.26 |
0.9264 times |
Wed 15 October 2025 |
5.05 (1.2%) |
4.93 |
4.85 - 5.08 |
0.5517 times |
Tue 14 October 2025 |
4.99 (-3.48%) |
5.09 |
4.58 - 5.13 |
0.4725 times |
Mon 13 October 2025 |
5.17 (-3.54%) |
5.40 |
5.13 - 5.63 |
0.8776 times |
Fri 10 October 2025 |
5.36 (-1.29%) |
5.45 |
5.12 - 5.45 |
2.1904 times |
Thu 09 October 2025 |
5.43 (-1.99%) |
5.55 |
5.32 - 5.58 |
1.0312 times |
Wed 08 October 2025 |
5.54 (3.36%) |
5.35 |
5.35 - 5.65 |
0.6145 times |
Tue 07 October 2025 |
5.36 (-5.13%) |
5.63 |
5.32 - 5.65 |
1.2267 times |
Mon 06 October 2025 |
5.65 (11.88%) |
5.07 |
5.07 - 5.70 |
2.6676 times |
Weekly price and charts TransactTechnologies Strong weekly Stock price targets for TransactTechnologies TACT are 4.62 and 4.85 | Weekly Target 1 | 4.46 | | Weekly Target 2 | 4.55 | | Weekly Target 3 | 4.6866666666667 | | Weekly Target 4 | 4.78 | | Weekly Target 5 | 4.92 |
Weekly price and volumes for Transact Technologies
| Date |
Closing |
Open |
Range |
Volume |
Mon 20 October 2025 |
4.65 (0.87%) |
4.61 |
4.59 - 4.82 |
0.1221 times |
Fri 17 October 2025 |
4.61 (-13.99%) |
5.40 |
4.53 - 5.63 |
0.6114 times |
Fri 10 October 2025 |
5.36 (6.14%) |
5.07 |
5.07 - 5.70 |
1.1484 times |
Fri 03 October 2025 |
5.05 (-4.72%) |
5.34 |
5.05 - 5.49 |
0.6899 times |
Fri 26 September 2025 |
5.30 (9.73%) |
4.82 |
4.80 - 5.48 |
1.1335 times |
Fri 19 September 2025 |
4.83 (6.15%) |
4.61 |
4.54 - 4.90 |
2.3358 times |
Fri 12 September 2025 |
4.55 (0.44%) |
4.53 |
4.53 - 4.76 |
0.5709 times |
Fri 05 September 2025 |
4.53 (4.38%) |
4.36 |
4.20 - 4.74 |
1.9568 times |
Fri 29 August 2025 |
4.34 (0%) |
4.18 |
4.17 - 4.38 |
0.4468 times |
Fri 29 August 2025 |
4.34 (-2.03%) |
4.46 |
4.09 - 4.50 |
0.9845 times |
Fri 22 August 2025 |
4.43 (9.11%) |
4.13 |
4.09 - 4.51 |
1.1601 times |
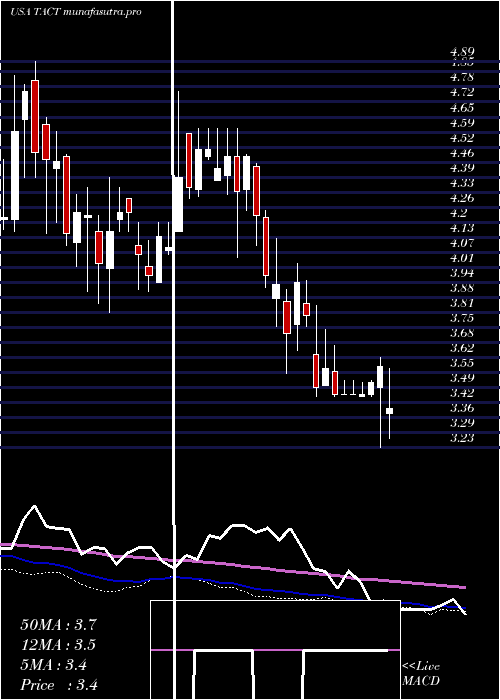
Monthly price and charts TransactTechnologies Strong monthly Stock price targets for TransactTechnologies TACT are 4.01 and 5.18 | Monthly Target 1 | 3.79 | | Monthly Target 2 | 4.22 | | Monthly Target 3 | 4.96 | | Monthly Target 4 | 5.39 | | Monthly Target 5 | 6.13 |
Monthly price and volumes Transact Technologies
| Date |
Closing |
Open |
Range |
Volume |
Mon 20 October 2025 |
4.65 (-14.21%) |
5.41 |
4.53 - 5.70 |
1.1652 times |
Tue 30 September 2025 |
5.42 (24.88%) |
4.36 |
4.20 - 5.48 |
3.3385 times |
Fri 29 August 2025 |
4.34 (16.04%) |
3.75 |
3.71 - 4.51 |
1.822 times |
Thu 31 July 2025 |
3.74 (2.19%) |
3.63 |
3.49 - 4.00 |
0.555 times |
Mon 30 June 2025 |
3.66 (-3.68%) |
3.64 |
3.33 - 3.84 |
0.4524 times |
Fri 30 May 2025 |
3.80 (9.2%) |
3.44 |
3.12 - 4.14 |
0.8044 times |
Wed 30 April 2025 |
3.48 (-5.43%) |
3.68 |
3.23 - 3.75 |
0.2235 times |
Mon 31 March 2025 |
3.68 (-7.3%) |
3.87 |
3.55 - 4.13 |
0.5968 times |
Fri 28 February 2025 |
3.97 (-11.38%) |
4.48 |
3.92 - 4.60 |
0.3535 times |
Fri 31 January 2025 |
4.48 (9.54%) |
4.08 |
4.06 - 4.76 |
0.6887 times |
Tue 31 December 2024 |
4.09 (-3.54%) |
4.10 |
3.90 - 4.20 |
0.4739 times |

DMA SMA EMA moving averages of Transact Technologies TACT
DMA (daily moving average) of Transact Technologies TACT
| DMA period | DMA value | | 5 day DMA | 4.82 | | 12 day DMA | 5.14 | | 20 day DMA | 5.21 | | 35 day DMA | 4.97 | | 50 day DMA | 4.76 | | 100 day DMA | 4.23 | | 150 day DMA | 4.02 | | 200 day DMA | 4.08 | EMA (exponential moving average) of Transact Technologies TACT
| EMA period | EMA current | EMA prev | EMA prev2 | | 5 day EMA | 4.81 | 4.89 | 5.03 | | 12 day EMA | 5.01 | 5.07 | 5.15 | | 20 day EMA | 5.02 | 5.06 | 5.11 | | 35 day EMA | 4.9 | 4.92 | 4.94 | | 50 day EMA | 4.68 | 4.68 | 4.68 |
SMA (simple moving average) of Transact Technologies TACT
| SMA period | SMA current | SMA prev | SMA prev2 | | 5 day SMA | 4.82 | 4.92 | 5.07 | | 12 day SMA | 5.14 | 5.18 | 5.25 | | 20 day SMA | 5.21 | 5.25 | 5.26 | | 35 day SMA | 4.97 | 4.96 | 4.96 | | 50 day SMA | 4.76 | 4.74 | 4.73 | | 100 day SMA | 4.23 | 4.22 | 4.21 | | 150 day SMA | 4.02 | 4.02 | 4.01 | | 200 day SMA | 4.08 | 4.08 | 4.08 |
|
|
