SynchronyFinancial SYF full analysis,charts,indicators,moving averages,SMA,DMA,EMA,ADX,MACD,RSISynchrony Financial SYF WideScreen charts, DMA,SMA,EMA technical analysis, forecast prediction, by indicators ADX,MACD,RSI,CCI USA stock exchange
operates under Finance sector & deals in Finance Consumer Services
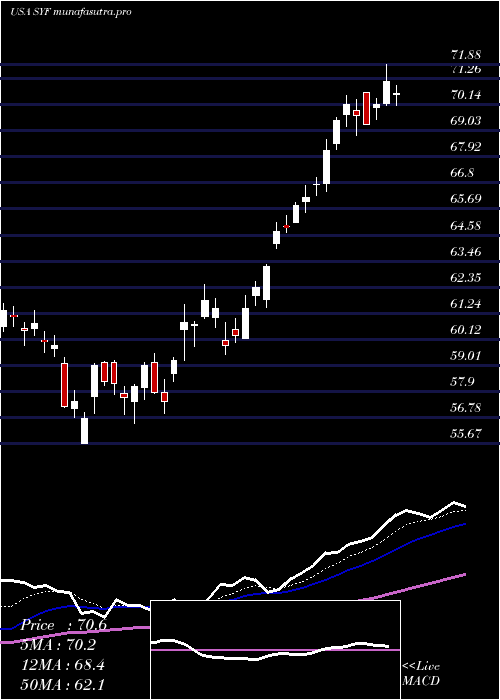
Daily price and charts and targets SynchronyFinancial Strong Daily Stock price targets for SynchronyFinancial SYF are 79.78 and 81.28 | Daily Target 1 | 78.57 | | Daily Target 2 | 79.48 | | Daily Target 3 | 80.066666666667 | | Daily Target 4 | 80.98 | | Daily Target 5 | 81.57 |
Daily price and volume Synchrony Financial
| Date |
Closing |
Open |
Range |
Volume |
Thu 04 December 2025 |
80.40 (1.58%) |
79.18 |
79.15 - 80.65 |
0.7772 times |
Wed 03 December 2025 |
79.15 (0.34%) |
78.77 |
78.71 - 80.40 |
1.3576 times |
Tue 02 December 2025 |
78.88 (1.06%) |
78.61 |
77.64 - 79.18 |
0.3654 times |
Mon 01 December 2025 |
78.05 (0.89%) |
76.96 |
76.15 - 78.40 |
1.2333 times |
Fri 28 November 2025 |
77.36 (0.53%) |
77.34 |
76.90 - 77.91 |
0.3384 times |
Wed 26 November 2025 |
76.95 (0.58%) |
76.44 |
76.26 - 77.55 |
0.7104 times |
Tue 25 November 2025 |
76.51 (2.68%) |
74.98 |
74.74 - 76.91 |
0.9704 times |
Mon 24 November 2025 |
74.51 (-0.15%) |
74.89 |
73.93 - 75.21 |
0.7694 times |
Fri 21 November 2025 |
74.62 (3.28%) |
72.78 |
72.51 - 75.46 |
1.4803 times |
Thu 20 November 2025 |
72.25 (-0.41%) |
73.97 |
72.17 - 75.28 |
1.9977 times |
Wed 19 November 2025 |
72.55 (1.87%) |
71.61 |
71.48 - 72.74 |
2.0399 times |
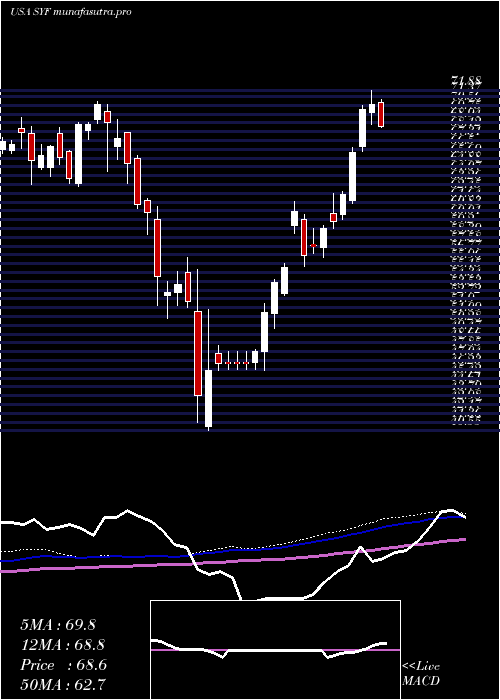
Weekly price and charts SynchronyFinancial Strong weekly Stock price targets for SynchronyFinancial SYF are 78.28 and 82.78 | Weekly Target 1 | 74.57 | | Weekly Target 2 | 77.48 | | Weekly Target 3 | 79.066666666667 | | Weekly Target 4 | 81.98 | | Weekly Target 5 | 83.57 |
Weekly price and volumes for Synchrony Financial
| Date |
Closing |
Open |
Range |
Volume |
Thu 04 December 2025 |
80.40 (3.93%) |
76.96 |
76.15 - 80.65 |
0.7699 times |
Fri 28 November 2025 |
77.36 (3.67%) |
74.89 |
73.93 - 77.91 |
0.575 times |
Fri 21 November 2025 |
74.62 (2.09%) |
72.80 |
69.51 - 75.46 |
1.7696 times |
Fri 14 November 2025 |
73.09 (-0.14%) |
73.70 |
72.10 - 76.11 |
1.1521 times |
Fri 07 November 2025 |
73.19 (-1.6%) |
73.20 |
71.85 - 75.24 |
1.0961 times |
Fri 31 October 2025 |
74.38 (0%) |
73.53 |
73.25 - 74.99 |
0.2257 times |
Fri 31 October 2025 |
74.38 (-0.63%) |
75.60 |
72.91 - 75.72 |
1.2157 times |
Fri 24 October 2025 |
74.85 (4.67%) |
72.00 |
71.46 - 75.70 |
0.8973 times |
Fri 17 October 2025 |
71.51 (0.86%) |
69.10 |
69.02 - 75.04 |
1.8869 times |
Tue 07 October 2025 |
70.90 (-0.46%) |
71.50 |
69.83 - 72.35 |
0.4116 times |
Fri 03 October 2025 |
71.23 (-4.44%) |
75.22 |
69.08 - 75.27 |
1.3103 times |
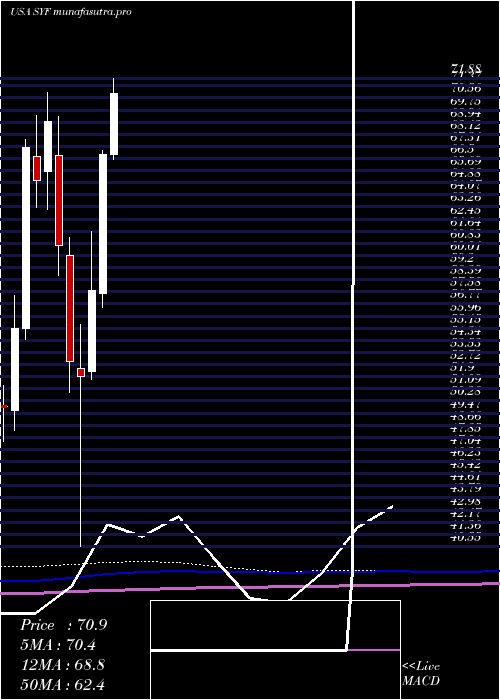
Monthly price and charts SynchronyFinancial Strong monthly Stock price targets for SynchronyFinancial SYF are 78.28 and 82.78 | Monthly Target 1 | 74.57 | | Monthly Target 2 | 77.48 | | Monthly Target 3 | 79.066666666667 | | Monthly Target 4 | 81.98 | | Monthly Target 5 | 83.57 |
Monthly price and volumes Synchrony Financial
| Date |
Closing |
Open |
Range |
Volume |
Thu 04 December 2025 |
80.40 (3.93%) |
76.96 |
76.15 - 80.65 |
0.1449 times |
Fri 28 November 2025 |
77.36 (4.01%) |
73.20 |
69.51 - 77.91 |
0.8644 times |
Fri 31 October 2025 |
74.38 (4.69%) |
71.09 |
69.02 - 75.72 |
1.0023 times |
Tue 30 September 2025 |
71.05 (-6.93%) |
74.98 |
69.28 - 77.41 |
0.9483 times |
Fri 29 August 2025 |
76.34 (9.57%) |
67.58 |
66.28 - 77.15 |
0.9178 times |
Thu 31 July 2025 |
69.67 (4.39%) |
66.80 |
66.43 - 73.76 |
1.0772 times |
Mon 30 June 2025 |
66.74 (15.77%) |
57.49 |
56.51 - 67.04 |
0.9391 times |
Fri 30 May 2025 |
57.65 (10.97%) |
52.28 |
51.72 - 61.65 |
1.0865 times |
Wed 30 April 2025 |
51.95 (-1.87%) |
52.48 |
40.55 - 55.43 |
1.5397 times |
Mon 31 March 2025 |
52.94 (-12.76%) |
60.01 |
50.85 - 61.19 |
1.4798 times |
Fri 28 February 2025 |
60.68 (-12.03%) |
66.73 |
58.66 - 69.29 |
1.093 times |
DMA SMA EMA moving averages of Synchrony Financial SYF
DMA (daily moving average) of Synchrony Financial SYF
| DMA period | DMA value | | 5 day DMA | 78.77 | | 12 day DMA | 76.04 | | 20 day DMA | 75.06 | | 35 day DMA | 74.38 | | 50 day DMA | 73.81 | | 100 day DMA | 73.28 | | 150 day DMA | 69.02 | | 200 day DMA | 65.03 | EMA (exponential moving average) of Synchrony Financial SYF
| EMA period | EMA current | EMA prev | EMA prev2 | | 5 day EMA | 78.8 | 78 | 77.42 | | 12 day EMA | 76.97 | 76.35 | 75.84 | | 20 day EMA | 75.95 | 75.48 | 75.09 | | 35 day EMA | 74.98 | 74.66 | 74.4 | | 50 day EMA | 74.46 | 74.22 | 74.02 |
SMA (simple moving average) of Synchrony Financial SYF
| SMA period | SMA current | SMA prev | SMA prev2 | | 5 day SMA | 78.77 | 78.08 | 77.55 | | 12 day SMA | 76.04 | 75.21 | 74.71 | | 20 day SMA | 75.06 | 74.76 | 74.46 | | 35 day SMA | 74.38 | 74.15 | 73.97 | | 50 day SMA | 73.81 | 73.73 | 73.68 | | 100 day SMA | 73.28 | 73.19 | 73.1 | | 150 day SMA | 69.02 | 68.82 | 68.64 | | 200 day SMA | 65.03 | 64.95 | 64.88 |
|
|
