ChinaSxt SXTC full analysis,charts,indicators,moving averages,SMA,DMA,EMA,ADX,MACD,RSIChina Sxt SXTC WideScreen charts, DMA,SMA,EMA technical analysis, forecast prediction, by indicators ADX,MACD,RSI,CCI USA stock exchange
operates under Health Care sector & deals in Major Pharmaceuticals
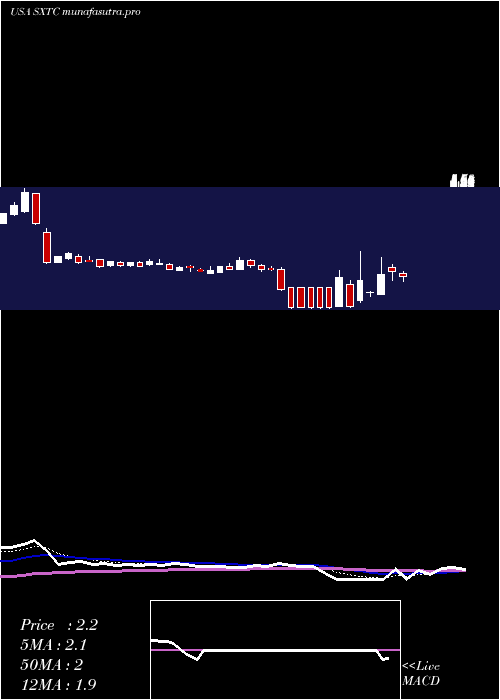
Daily price and charts and targets ChinaSxt Strong Daily Stock price targets for ChinaSxt SXTC are 1.3 and 1.44 | Daily Target 1 | 1.27 | | Daily Target 2 | 1.33 | | Daily Target 3 | 1.4133333333333 | | Daily Target 4 | 1.47 | | Daily Target 5 | 1.55 |
Daily price and volume China Sxt
| Date |
Closing |
Open |
Range |
Volume |
Mon 20 October 2025 |
1.38 (-0.72%) |
1.46 |
1.36 - 1.50 |
0.7645 times |
Fri 17 October 2025 |
1.39 (-2.11%) |
1.42 |
1.39 - 1.42 |
0.1911 times |
Thu 16 October 2025 |
1.42 (-2.07%) |
1.41 |
1.40 - 1.47 |
0.9969 times |
Wed 15 October 2025 |
1.45 (0%) |
1.42 |
1.42 - 1.46 |
0.1395 times |
Tue 14 October 2025 |
1.45 (0%) |
1.47 |
1.40 - 1.47 |
0.6043 times |
Mon 13 October 2025 |
1.45 (-2.03%) |
1.54 |
1.41 - 1.54 |
0.6147 times |
Fri 10 October 2025 |
1.48 (-4.52%) |
1.50 |
1.42 - 1.59 |
3.0165 times |
Thu 09 October 2025 |
1.55 (-0.64%) |
1.64 |
1.54 - 1.64 |
0.687 times |
Wed 08 October 2025 |
1.56 (-4.88%) |
1.63 |
1.51 - 1.66 |
1.689 times |
Tue 07 October 2025 |
1.64 (0%) |
1.57 |
1.57 - 1.68 |
1.2965 times |
Mon 06 October 2025 |
1.64 (0%) |
1.60 |
1.55 - 1.66 |
0.7593 times |
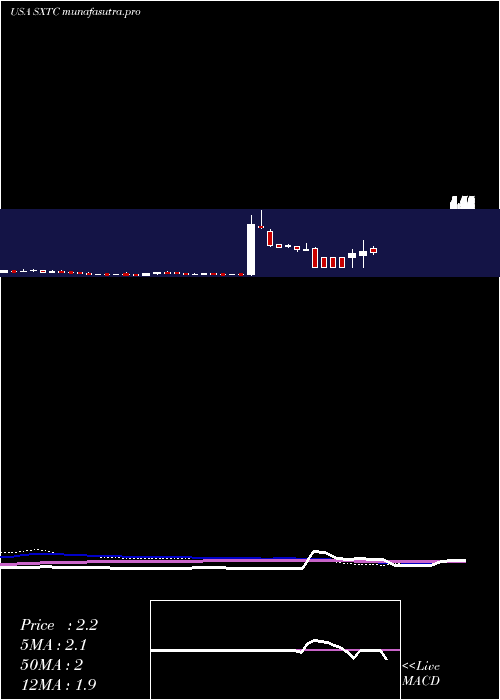
Weekly price and charts ChinaSxt Strong weekly Stock price targets for ChinaSxt SXTC are 1.3 and 1.44 | Weekly Target 1 | 1.27 | | Weekly Target 2 | 1.33 | | Weekly Target 3 | 1.4133333333333 | | Weekly Target 4 | 1.47 | | Weekly Target 5 | 1.55 |
Weekly price and volumes for China Sxt
| Date |
Closing |
Open |
Range |
Volume |
Mon 20 October 2025 |
1.38 (-0.72%) |
1.46 |
1.36 - 1.50 |
0.0081 times |
Fri 17 October 2025 |
1.39 (-6.08%) |
1.54 |
1.39 - 1.54 |
0.027 times |
Fri 10 October 2025 |
1.48 (-9.76%) |
1.60 |
1.42 - 1.68 |
0.079 times |
Fri 03 October 2025 |
1.64 (0.61%) |
1.63 |
1.53 - 1.84 |
0.0694 times |
Fri 26 September 2025 |
1.63 (-16.41%) |
1.91 |
1.35 - 2.05 |
0.2858 times |
Fri 19 September 2025 |
1.95 (-1.52%) |
1.91 |
1.75 - 2.08 |
0.2638 times |
Fri 12 September 2025 |
1.98 (22.98%) |
1.59 |
1.33 - 2.07 |
4.0228 times |
Fri 05 September 2025 |
1.61 (10.27%) |
1.44 |
1.13 - 1.61 |
5.1869 times |
Fri 29 August 2025 |
1.46 (0%) |
1.54 |
1.46 - 1.54 |
0.0018 times |
Fri 29 August 2025 |
1.46 (-7.01%) |
1.60 |
1.44 - 1.60 |
0.0555 times |
Fri 22 August 2025 |
1.57 (-1.88%) |
1.62 |
1.50 - 1.64 |
0.0396 times |
Monthly price and charts ChinaSxt Strong monthly Stock price targets for ChinaSxt SXTC are 1.13 and 1.61 | Monthly Target 1 | 1.05 | | Monthly Target 2 | 1.21 | | Monthly Target 3 | 1.5266666666667 | | Monthly Target 4 | 1.69 | | Monthly Target 5 | 2.01 |
Monthly price and volumes China Sxt
| Date |
Closing |
Open |
Range |
Volume |
Mon 20 October 2025 |
1.38 (-12.1%) |
1.59 |
1.36 - 1.84 |
0.0121 times |
Tue 30 September 2025 |
1.57 (7.53%) |
1.44 |
1.13 - 2.08 |
0.7984 times |
Fri 29 August 2025 |
1.46 (-6.41%) |
1.56 |
1.44 - 1.73 |
0.0224 times |
Thu 31 July 2025 |
1.56 (-9.83%) |
1.75 |
1.49 - 1.92 |
0.0674 times |
Mon 30 June 2025 |
1.73 (24.46%) |
1.35 |
1.01 - 2.37 |
0.6008 times |
Fri 30 May 2025 |
1.39 (-40.6%) |
2.34 |
0.95 - 2.45 |
2.116 times |
Wed 30 April 2025 |
2.34 (-6.02%) |
2.45 |
0.97 - 3.22 |
4.2711 times |
Mon 31 March 2025 |
2.49 (-44.79%) |
4.35 |
2.49 - 5.70 |
0.0418 times |
Fri 28 February 2025 |
4.51 (1000%) |
0.40 |
0.31 - 5.27 |
1.5148 times |
Fri 31 January 2025 |
0.41 (-19.61%) |
0.50 |
0.36 - 0.60 |
0.5552 times |
Tue 31 December 2024 |
0.51 (30.77%) |
0.41 |
0.30 - 0.57 |
2.2544 times |

DMA SMA EMA moving averages of China Sxt SXTC
DMA (daily moving average) of China Sxt SXTC
| DMA period | DMA value | | 5 day DMA | 1.42 | | 12 day DMA | 1.5 | | 20 day DMA | 1.56 | | 35 day DMA | 1.62 | | 50 day DMA | 1.6 | | 100 day DMA | 1.64 | | 150 day DMA | 1.77 | | 200 day DMA | 1.69 | EMA (exponential moving average) of China Sxt SXTC
| EMA period | EMA current | EMA prev | EMA prev2 | | 5 day EMA | 1.42 | 1.44 | 1.46 | | 12 day EMA | 1.49 | 1.51 | 1.53 | | 20 day EMA | 1.53 | 1.55 | 1.57 | | 35 day EMA | 1.56 | 1.57 | 1.58 | | 50 day EMA | 1.56 | 1.57 | 1.58 |
SMA (simple moving average) of China Sxt SXTC
| SMA period | SMA current | SMA prev | SMA prev2 | | 5 day SMA | 1.42 | 1.43 | 1.45 | | 12 day SMA | 1.5 | 1.53 | 1.54 | | 20 day SMA | 1.56 | 1.59 | 1.62 | | 35 day SMA | 1.62 | 1.63 | 1.63 | | 50 day SMA | 1.6 | 1.6 | 1.61 | | 100 day SMA | 1.64 | 1.64 | 1.65 | | 150 day SMA | 1.77 | 1.78 | 1.79 | | 200 day SMA | 1.69 | 1.69 | 1.68 |
|
|
