StanleyBlack SWP full analysis,charts,indicators,moving averages,SMA,DMA,EMA,ADX,MACD,RSIStanley Black SWP WideScreen charts, DMA,SMA,EMA technical analysis, forecast prediction, by indicators ADX,MACD,RSI,CCI USA stock exchange
operates under Capital Goods sector & deals in Industrial Machinery Components
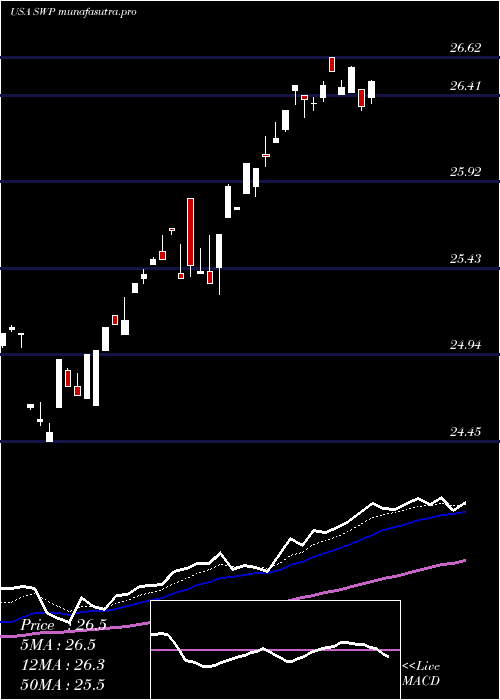
Daily price and charts and targets StanleyBlack Strong Daily Stock price targets for StanleyBlack SWP are 27.81 and 27.87 | Daily Target 1 | 27.77 | | Daily Target 2 | 27.79 | | Daily Target 3 | 27.826666666667 | | Daily Target 4 | 27.85 | | Daily Target 5 | 27.89 |
Daily price and volume Stanley Black
| Date |
Closing |
Open |
Range |
Volume |
Tue 21 October 2025 |
27.82 (-0.07%) |
27.80 |
27.80 - 27.86 |
0.9415 times |
Mon 20 October 2025 |
27.84 (0.83%) |
27.81 |
27.76 - 27.85 |
1.0842 times |
Fri 17 October 2025 |
27.61 (0.4%) |
27.55 |
27.49 - 27.65 |
1.5407 times |
Thu 16 October 2025 |
27.50 (-0.97%) |
27.71 |
27.49 - 27.71 |
1.184 times |
Wed 15 October 2025 |
27.77 (0.36%) |
27.97 |
27.64 - 27.97 |
0.5991 times |
Tue 14 October 2025 |
27.67 (0.4%) |
27.48 |
27.48 - 27.78 |
1.669 times |
Mon 13 October 2025 |
27.56 (1.92%) |
27.47 |
27.47 - 27.60 |
1.8117 times |
Fri 10 October 2025 |
27.04 (-2.21%) |
27.76 |
27.04 - 27.76 |
0.8702 times |
Thu 09 October 2025 |
27.65 (-0.58%) |
27.65 |
27.65 - 27.65 |
0.0143 times |
Wed 08 October 2025 |
27.81 (0%) |
27.85 |
27.81 - 27.85 |
0.2853 times |
Tue 07 October 2025 |
27.81 (-0.68%) |
27.80 |
27.78 - 27.81 |
0.7133 times |
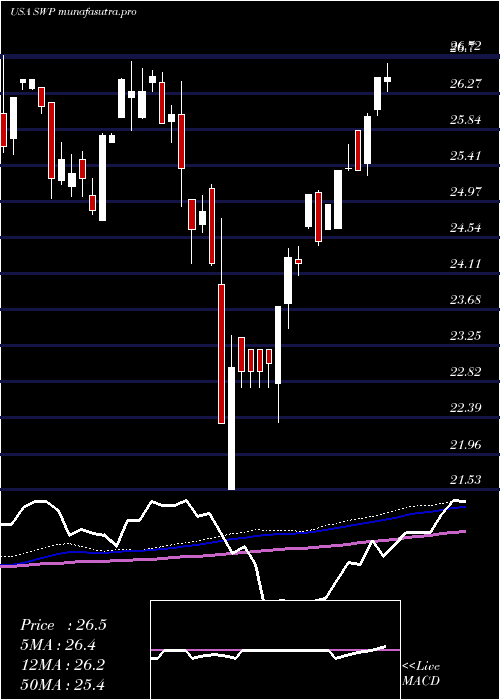
Weekly price and charts StanleyBlack Strong weekly Stock price targets for StanleyBlack SWP are 27.79 and 27.89 | Weekly Target 1 | 27.71 | | Weekly Target 2 | 27.77 | | Weekly Target 3 | 27.813333333333 | | Weekly Target 4 | 27.87 | | Weekly Target 5 | 27.91 |
Weekly price and volumes for Stanley Black
| Date |
Closing |
Open |
Range |
Volume |
Tue 21 October 2025 |
27.82 (0.76%) |
27.81 |
27.76 - 27.86 |
0.3753 times |
Fri 17 October 2025 |
27.61 (2.11%) |
27.47 |
27.47 - 27.97 |
1.2607 times |
Fri 10 October 2025 |
27.04 (-3.01%) |
27.90 |
27.04 - 28.02 |
0.4493 times |
Fri 03 October 2025 |
27.88 (-0.75%) |
27.70 |
27.46 - 27.92 |
1.0617 times |
Fri 26 September 2025 |
28.09 (-0.74%) |
28.41 |
27.86 - 28.51 |
0.8801 times |
Fri 19 September 2025 |
28.30 (0.71%) |
28.16 |
28.07 - 28.30 |
2.1593 times |
Fri 12 September 2025 |
28.10 (2.03%) |
27.54 |
27.54 - 28.23 |
0.9964 times |
Fri 05 September 2025 |
27.54 (0.66%) |
27.12 |
27.06 - 27.54 |
1.0757 times |
Fri 29 August 2025 |
27.36 (0%) |
27.41 |
27.27 - 27.41 |
0.6581 times |
Fri 29 August 2025 |
27.36 (0.18%) |
27.28 |
27.16 - 27.51 |
1.0836 times |
Fri 22 August 2025 |
27.31 (0.63%) |
27.13 |
26.84 - 27.36 |
0.7982 times |
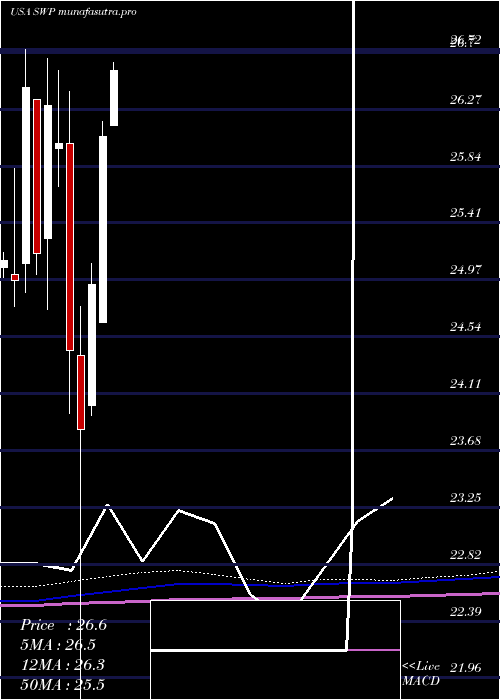
Monthly price and charts StanleyBlack Strong monthly Stock price targets for StanleyBlack SWP are 27.43 and 28.41 | Monthly Target 1 | 26.65 | | Monthly Target 2 | 27.23 | | Monthly Target 3 | 27.626666666667 | | Monthly Target 4 | 28.21 | | Monthly Target 5 | 28.61 |
Monthly price and volumes Stanley Black
| Date |
Closing |
Open |
Range |
Volume |
Tue 21 October 2025 |
27.82 (0.51%) |
27.63 |
27.04 - 28.02 |
0.4115 times |
Tue 30 September 2025 |
27.68 (1.17%) |
27.12 |
27.06 - 28.51 |
0.8457 times |
Fri 29 August 2025 |
27.36 (1.63%) |
26.58 |
26.53 - 27.51 |
0.8836 times |
Thu 31 July 2025 |
26.92 (3.3%) |
26.14 |
26.14 - 27.23 |
1.6838 times |
Mon 30 June 2025 |
26.06 (4.49%) |
24.65 |
24.65 - 26.17 |
1.1616 times |
Fri 30 May 2025 |
24.94 (4.61%) |
24.02 |
23.95 - 25.10 |
1.131 times |
Wed 30 April 2025 |
23.84 (-2.45%) |
24.40 |
21.53 - 24.77 |
1.0046 times |
Mon 31 March 2025 |
24.44 (-6.04%) |
26.01 |
23.96 - 26.40 |
0.7837 times |
Fri 28 February 2025 |
26.01 (-1.07%) |
25.97 |
25.68 - 26.56 |
0.9644 times |
Fri 31 January 2025 |
26.29 (4.45%) |
25.29 |
24.75 - 26.65 |
1.1301 times |
Tue 31 December 2024 |
25.17 (-4.77%) |
26.34 |
25.01 - 26.34 |
0.9637 times |
DMA SMA EMA moving averages of Stanley Black SWP
DMA (daily moving average) of Stanley Black SWP
| DMA period | DMA value | | 5 day DMA | 27.71 | | 12 day DMA | 27.67 | | 20 day DMA | 27.75 | | 35 day DMA | 27.85 | | 50 day DMA | 27.66 | | 100 day DMA | 26.92 | | 150 day DMA | 25.94 | | 200 day DMA | 25.9 | EMA (exponential moving average) of Stanley Black SWP
| EMA period | EMA current | EMA prev | EMA prev2 | | 5 day EMA | 27.73 | 27.68 | 27.6 | | 12 day EMA | 27.72 | 27.7 | 27.67 | | 20 day EMA | 27.72 | 27.71 | 27.7 | | 35 day EMA | 27.65 | 27.64 | 27.63 | | 50 day EMA | 27.61 | 27.6 | 27.59 |
SMA (simple moving average) of Stanley Black SWP
| SMA period | SMA current | SMA prev | SMA prev2 | | 5 day SMA | 27.71 | 27.68 | 27.62 | | 12 day SMA | 27.67 | 27.68 | 27.67 | | 20 day SMA | 27.75 | 27.78 | 27.81 | | 35 day SMA | 27.85 | 27.83 | 27.82 | | 50 day SMA | 27.66 | 27.65 | 27.63 | | 100 day SMA | 26.92 | 26.89 | 26.86 | | 150 day SMA | 25.94 | 25.92 | 25.9 | | 200 day SMA | 25.9 | 25.89 | 25.87 |
|
|
