SolarSenior SUNS full analysis,charts,indicators,moving averages,SMA,DMA,EMA,ADX,MACD,RSISolar Senior SUNS WideScreen charts, DMA,SMA,EMA technical analysis, forecast prediction, by indicators ADX,MACD,RSI,CCI USA stock exchange
operates under N A sector & deals in N A
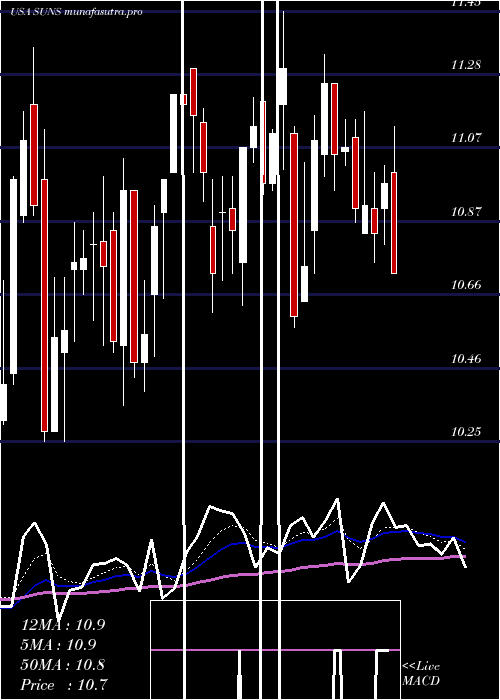
Daily price and charts and targets SolarSenior Strong Daily Stock price targets for SolarSenior SUNS are 9.61 and 9.83 | Daily Target 1 | 9.43 | | Daily Target 2 | 9.57 | | Daily Target 3 | 9.6466666666667 | | Daily Target 4 | 9.79 | | Daily Target 5 | 9.87 |
Daily price and volume Solar Senior
| Date |
Closing |
Open |
Range |
Volume |
Mon 20 October 2025 |
9.72 (3.29%) |
9.57 |
9.50 - 9.72 |
0.6345 times |
Fri 17 October 2025 |
9.41 (-0.53%) |
9.49 |
9.35 - 9.67 |
0.715 times |
Thu 16 October 2025 |
9.46 (-3.76%) |
9.78 |
9.31 - 9.97 |
1.5674 times |
Wed 15 October 2025 |
9.83 (-1.6%) |
10.05 |
9.65 - 10.14 |
0.8469 times |
Tue 14 October 2025 |
9.99 (5.71%) |
9.38 |
9.38 - 10.13 |
1.2134 times |
Mon 13 October 2025 |
9.45 (-1.77%) |
9.68 |
9.37 - 9.72 |
0.7191 times |
Fri 10 October 2025 |
9.62 (-1.74%) |
9.80 |
9.51 - 9.94 |
1.4313 times |
Thu 09 October 2025 |
9.79 (-1.51%) |
9.94 |
9.71 - 10.01 |
0.7497 times |
Wed 08 October 2025 |
9.94 (1.12%) |
9.85 |
9.78 - 9.99 |
0.7969 times |
Tue 07 October 2025 |
9.83 (-1.31%) |
9.95 |
9.77 - 9.95 |
1.3258 times |
Mon 06 October 2025 |
9.96 (-1.58%) |
10.16 |
9.90 - 10.45 |
1.1551 times |
Weekly price and charts SolarSenior Strong weekly Stock price targets for SolarSenior SUNS are 9.61 and 9.83 | Weekly Target 1 | 9.43 | | Weekly Target 2 | 9.57 | | Weekly Target 3 | 9.6466666666667 | | Weekly Target 4 | 9.79 | | Weekly Target 5 | 9.87 |
Weekly price and volumes for Solar Senior
| Date |
Closing |
Open |
Range |
Volume |
Mon 20 October 2025 |
9.72 (3.29%) |
9.57 |
9.50 - 9.72 |
0.1725 times |
Fri 17 October 2025 |
9.41 (-2.18%) |
9.68 |
9.31 - 10.14 |
1.3765 times |
Fri 10 October 2025 |
9.62 (-4.94%) |
10.16 |
9.51 - 10.45 |
1.4844 times |
Fri 03 October 2025 |
10.12 (-7.75%) |
11.05 |
9.95 - 11.06 |
1.1606 times |
Fri 26 September 2025 |
10.97 (-1.17%) |
11.15 |
10.68 - 11.30 |
0.9699 times |
Fri 19 September 2025 |
11.10 (-1.51%) |
11.23 |
11.01 - 11.78 |
2.1893 times |
Fri 12 September 2025 |
11.27 (3.97%) |
10.91 |
10.80 - 11.36 |
0.7811 times |
Fri 05 September 2025 |
10.84 (-1.99%) |
10.91 |
10.74 - 11.17 |
0.7739 times |
Fri 29 August 2025 |
11.06 (0%) |
11.00 |
10.89 - 11.11 |
0.208 times |
Fri 29 August 2025 |
11.06 (-0.09%) |
11.00 |
10.70 - 11.21 |
0.8838 times |
Fri 22 August 2025 |
11.07 (4.73%) |
10.61 |
10.25 - 11.27 |
1.244 times |
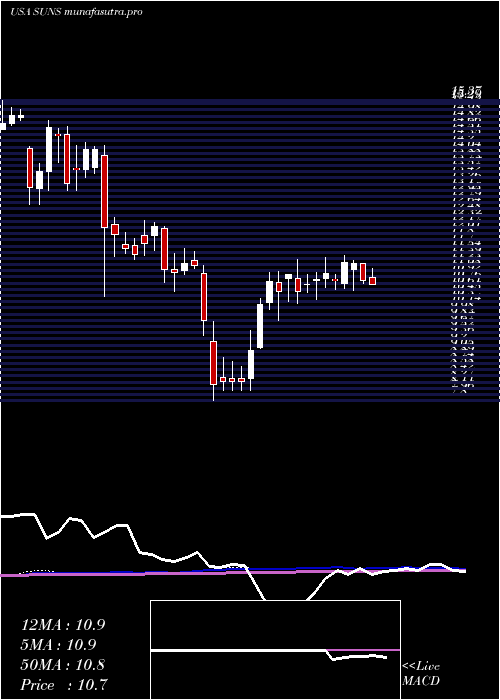
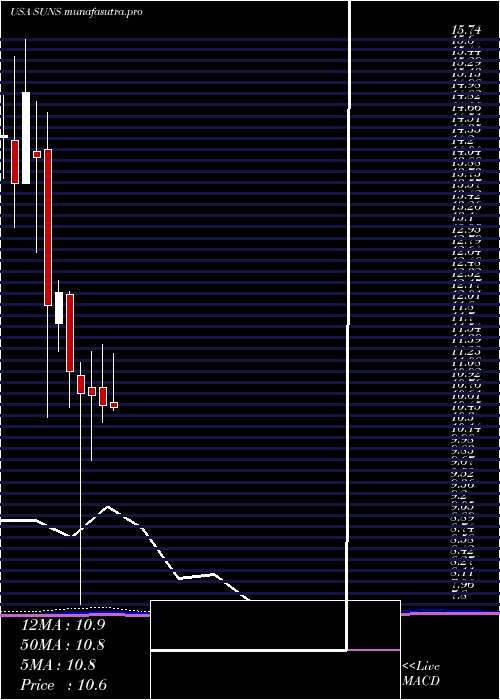
Monthly price and charts SolarSenior Strong monthly Stock price targets for SolarSenior SUNS are 8.95 and 10.09 | Monthly Target 1 | 8.69 | | Monthly Target 2 | 9.2 | | Monthly Target 3 | 9.8266666666667 | | Monthly Target 4 | 10.34 | | Monthly Target 5 | 10.97 |
Monthly price and volumes Solar Senior
| Date |
Closing |
Open |
Range |
Volume |
Mon 20 October 2025 |
9.72 (-6.45%) |
10.39 |
9.31 - 10.45 |
0.4758 times |
Tue 30 September 2025 |
10.39 (-6.06%) |
10.91 |
10.28 - 11.78 |
0.7094 times |
Fri 29 August 2025 |
11.06 (10.49%) |
10.00 |
9.68 - 11.27 |
0.6668 times |
Thu 31 July 2025 |
10.01 (-5.57%) |
10.64 |
10.00 - 11.33 |
0.6143 times |
Mon 30 June 2025 |
10.60 (-1.3%) |
10.84 |
10.35 - 11.45 |
0.7103 times |
Fri 30 May 2025 |
10.74 (-0.19%) |
10.84 |
9.82 - 11.35 |
0.7194 times |
Wed 30 April 2025 |
10.76 (-2.8%) |
11.02 |
7.80 - 11.20 |
1.2423 times |
Mon 31 March 2025 |
11.07 (-9.11%) |
12.15 |
10.56 - 12.20 |
1.7228 times |
Fri 28 February 2025 |
12.18 (1.5%) |
11.74 |
11.35 - 12.35 |
1.3006 times |
Fri 31 January 2025 |
12.00 (-14.77%) |
14.20 |
10.43 - 14.72 |
1.8383 times |
Tue 31 December 2024 |
14.08 (-6.07%) |
14.17 |
12.75 - 14.87 |
0.5771 times |
DMA SMA EMA moving averages of Solar Senior SUNS
DMA (daily moving average) of Solar Senior SUNS
| DMA period | DMA value | | 5 day DMA | 9.68 | | 12 day DMA | 9.76 | | 20 day DMA | 10.11 | | 35 day DMA | 10.56 | | 50 day DMA | 10.63 | | 100 day DMA | 10.66 | | 150 day DMA | 10.49 | | 200 day DMA | 10.94 | EMA (exponential moving average) of Solar Senior SUNS
| EMA period | EMA current | EMA prev | EMA prev2 | | 5 day EMA | 9.64 | 9.6 | 9.69 | | 12 day EMA | 9.82 | 9.84 | 9.92 | | 20 day EMA | 10.05 | 10.08 | 10.15 | | 35 day EMA | 10.25 | 10.28 | 10.33 | | 50 day EMA | 10.48 | 10.51 | 10.56 |
SMA (simple moving average) of Solar Senior SUNS
| SMA period | SMA current | SMA prev | SMA prev2 | | 5 day SMA | 9.68 | 9.63 | 9.67 | | 12 day SMA | 9.76 | 9.79 | 9.85 | | 20 day SMA | 10.11 | 10.18 | 10.27 | | 35 day SMA | 10.56 | 10.6 | 10.64 | | 50 day SMA | 10.63 | 10.65 | 10.66 | | 100 day SMA | 10.66 | 10.67 | 10.68 | | 150 day SMA | 10.49 | 10.5 | 10.51 | | 200 day SMA | 10.94 | 10.96 | 10.98 |
|
|
