SunCommunities SUI full analysis,charts,indicators,moving averages,SMA,DMA,EMA,ADX,MACD,RSISun Communities SUI WideScreen charts, DMA,SMA,EMA technical analysis, forecast prediction, by indicators ADX,MACD,RSI,CCI USA stock exchange
operates under Consumer Services sector & deals in Real Estate Investment Trusts
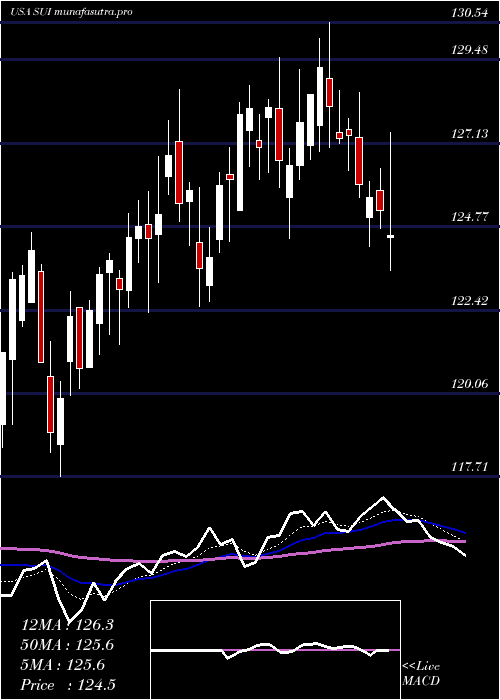
Daily price and charts and targets SunCommunities Strong Daily Stock price targets for SunCommunities SUI are 125.01 and 126.52 | Daily Target 1 | 123.79 | | Daily Target 2 | 124.72 | | Daily Target 3 | 125.3 | | Daily Target 4 | 126.23 | | Daily Target 5 | 126.81 |
Daily price and volume Sun Communities
| Date |
Closing |
Open |
Range |
Volume |
Wed 22 October 2025 |
125.65 (0.73%) |
125.36 |
124.37 - 125.88 |
0.7294 times |
Tue 21 October 2025 |
124.74 (0.31%) |
124.57 |
123.88 - 125.23 |
0.7437 times |
Mon 20 October 2025 |
124.36 (0.46%) |
124.04 |
122.61 - 124.40 |
0.5839 times |
Fri 17 October 2025 |
123.79 (0.08%) |
123.69 |
122.83 - 124.29 |
0.768 times |
Thu 16 October 2025 |
123.69 (-0.74%) |
125.02 |
122.70 - 125.50 |
0.8245 times |
Wed 15 October 2025 |
124.61 (1.17%) |
123.23 |
121.77 - 126.29 |
1.2583 times |
Tue 14 October 2025 |
123.17 (1.42%) |
121.81 |
121.28 - 123.46 |
1.8692 times |
Mon 13 October 2025 |
121.44 (-3.74%) |
122.48 |
120.45 - 123.41 |
1.4069 times |
Tue 07 October 2025 |
126.16 (-1.05%) |
127.77 |
125.61 - 128.04 |
1.3398 times |
Mon 06 October 2025 |
127.50 (-2.03%) |
130.01 |
127.44 - 130.01 |
0.4763 times |
Fri 03 October 2025 |
130.14 (1.13%) |
128.89 |
128.85 - 131.50 |
0.7296 times |
Weekly price and charts SunCommunities Strong weekly Stock price targets for SunCommunities SUI are 124.13 and 127.4 | Weekly Target 1 | 121.44 | | Weekly Target 2 | 123.55 | | Weekly Target 3 | 124.71333333333 | | Weekly Target 4 | 126.82 | | Weekly Target 5 | 127.98 |
Weekly price and volumes for Sun Communities
| Date |
Closing |
Open |
Range |
Volume |
Wed 22 October 2025 |
125.65 (1.5%) |
124.04 |
122.61 - 125.88 |
0.4654 times |
Fri 17 October 2025 |
123.79 (-1.88%) |
122.48 |
120.45 - 126.29 |
1.3861 times |
Tue 07 October 2025 |
126.16 (-3.06%) |
130.01 |
125.61 - 130.01 |
0.4109 times |
Fri 03 October 2025 |
130.14 (1.13%) |
129.05 |
126.93 - 131.50 |
1.0214 times |
Fri 26 September 2025 |
128.68 (0.44%) |
127.59 |
127.22 - 129.99 |
1.0179 times |
Fri 19 September 2025 |
128.11 (-1.45%) |
130.26 |
127.35 - 131.31 |
1.6423 times |
Fri 12 September 2025 |
130.00 (0.14%) |
128.29 |
127.20 - 131.78 |
1.1737 times |
Fri 05 September 2025 |
129.82 (2.33%) |
125.95 |
124.47 - 130.97 |
1.2451 times |
Fri 29 August 2025 |
126.87 (0%) |
125.06 |
125.06 - 126.99 |
0.2631 times |
Fri 29 August 2025 |
126.87 (-0.13%) |
127.18 |
124.51 - 127.51 |
1.3739 times |
Fri 22 August 2025 |
127.04 (-0.57%) |
127.88 |
125.32 - 128.60 |
1.1707 times |
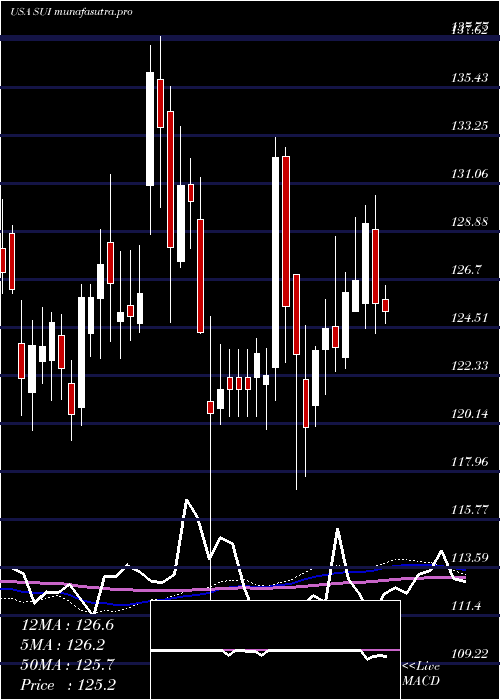
Monthly price and charts SunCommunities Strong monthly Stock price targets for SunCommunities SUI are 117.53 and 128.58 | Monthly Target 1 | 114.82 | | Monthly Target 2 | 120.23 | | Monthly Target 3 | 125.86666666667 | | Monthly Target 4 | 131.28 | | Monthly Target 5 | 136.92 |
Monthly price and volumes Sun Communities
| Date |
Closing |
Open |
Range |
Volume |
Wed 22 October 2025 |
125.65 (-2.6%) |
129.31 |
120.45 - 131.50 |
0.5435 times |
Tue 30 September 2025 |
129.00 (1.68%) |
125.95 |
124.47 - 131.78 |
1.0602 times |
Fri 29 August 2025 |
126.87 (2.29%) |
125.24 |
123.40 - 128.60 |
1.2413 times |
Thu 31 July 2025 |
124.03 (-1.94%) |
126.51 |
115.53 - 130.54 |
1.4009 times |
Mon 30 June 2025 |
126.49 (2.47%) |
123.49 |
121.45 - 129.54 |
1.0194 times |
Fri 30 May 2025 |
123.44 (-0.8%) |
125.00 |
117.14 - 133.19 |
0.9746 times |
Wed 30 April 2025 |
124.43 (-3.27%) |
129.51 |
109.22 - 131.35 |
0.7473 times |
Mon 31 March 2025 |
128.64 (-5.52%) |
135.83 |
124.74 - 137.77 |
0.9954 times |
Fri 28 February 2025 |
136.15 (7.63%) |
124.77 |
123.10 - 137.36 |
0.9251 times |
Fri 31 January 2025 |
126.50 (2.87%) |
122.49 |
119.36 - 131.49 |
1.0922 times |
Tue 31 December 2024 |
122.97 (-3.2%) |
126.38 |
119.81 - 126.38 |
0.8327 times |
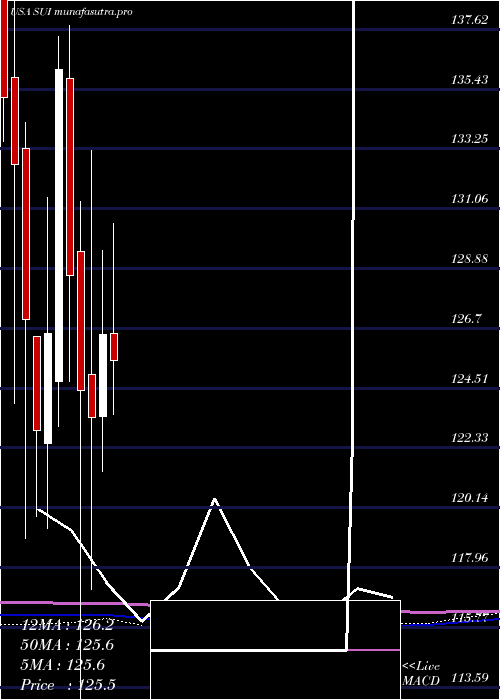
DMA SMA EMA moving averages of Sun Communities SUI
DMA (daily moving average) of Sun Communities SUI
| DMA period | DMA value | | 5 day DMA | 124.45 | | 12 day DMA | 125.33 | | 20 day DMA | 126.64 | | 35 day DMA | 127.42 | | 50 day DMA | 127.14 | | 100 day DMA | 125.99 | | 150 day DMA | 125.54 | | 200 day DMA | 125.97 | EMA (exponential moving average) of Sun Communities SUI
| EMA period | EMA current | EMA prev | EMA prev2 | | 5 day EMA | 124.82 | 124.41 | 124.25 | | 12 day EMA | 125.34 | 125.28 | 125.38 | | 20 day EMA | 125.99 | 126.03 | 126.17 | | 35 day EMA | 126.41 | 126.45 | 126.55 | | 50 day EMA | 126.74 | 126.78 | 126.86 |
SMA (simple moving average) of Sun Communities SUI
| SMA period | SMA current | SMA prev | SMA prev2 | | 5 day SMA | 124.45 | 124.24 | 123.92 | | 12 day SMA | 125.33 | 125.57 | 125.92 | | 20 day SMA | 126.64 | 126.76 | 126.92 | | 35 day SMA | 127.42 | 127.45 | 127.47 | | 50 day SMA | 127.14 | 127.13 | 127.14 | | 100 day SMA | 125.99 | 125.93 | 125.87 | | 150 day SMA | 125.54 | 125.55 | 125.56 | | 200 day SMA | 125.97 | 125.95 | 125.94 |
|
|
