SuncorEnergy SU full analysis,charts,indicators,moving averages,SMA,DMA,EMA,ADX,MACD,RSISuncor Energy SU WideScreen charts, DMA,SMA,EMA technical analysis, forecast prediction, by indicators ADX,MACD,RSI,CCI USA stock exchange
operates under Energy sector & deals in Integrated Oil Companies
Daily price and charts and targets SuncorEnergy Strong Daily Stock price targets for SuncorEnergy SU are 44.38 and 45.13 | Daily Target 1 | 44.24 | | Daily Target 2 | 44.51 | | Daily Target 3 | 44.993333333333 | | Daily Target 4 | 45.26 | | Daily Target 5 | 45.74 |
Daily price and volume Suncor Energy
| Date |
Closing |
Open |
Range |
Volume |
Thu 04 December 2025 |
44.77 (0.2%) |
44.86 |
44.73 - 45.48 |
1.4044 times |
Wed 03 December 2025 |
44.68 (1.71%) |
43.83 |
43.74 - 44.83 |
1.7899 times |
Tue 02 December 2025 |
43.93 (-1.94%) |
44.95 |
43.85 - 44.95 |
0.5427 times |
Mon 01 December 2025 |
44.80 (0.04%) |
45.23 |
44.60 - 45.42 |
0.9891 times |
Fri 28 November 2025 |
44.78 (0.74%) |
44.63 |
44.54 - 45.18 |
0.3653 times |
Wed 26 November 2025 |
44.45 (0.32%) |
44.35 |
44.26 - 44.69 |
0.7748 times |
Tue 25 November 2025 |
44.31 (0.09%) |
44.05 |
43.69 - 44.58 |
1.2491 times |
Mon 24 November 2025 |
44.27 (-0.11%) |
44.32 |
43.55 - 44.35 |
0.8155 times |
Fri 21 November 2025 |
44.32 (-0.78%) |
44.52 |
43.95 - 44.62 |
1.1072 times |
Thu 20 November 2025 |
44.67 (-0.69%) |
45.00 |
44.65 - 45.60 |
0.9619 times |
Wed 19 November 2025 |
44.98 (-0.49%) |
44.58 |
44.27 - 45.04 |
0.6295 times |
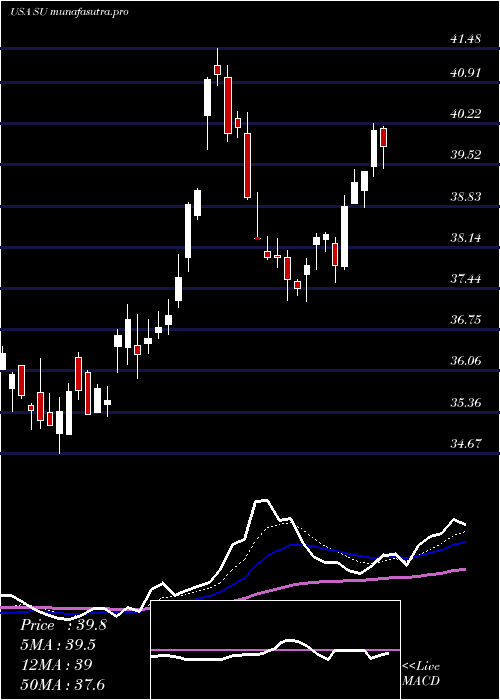
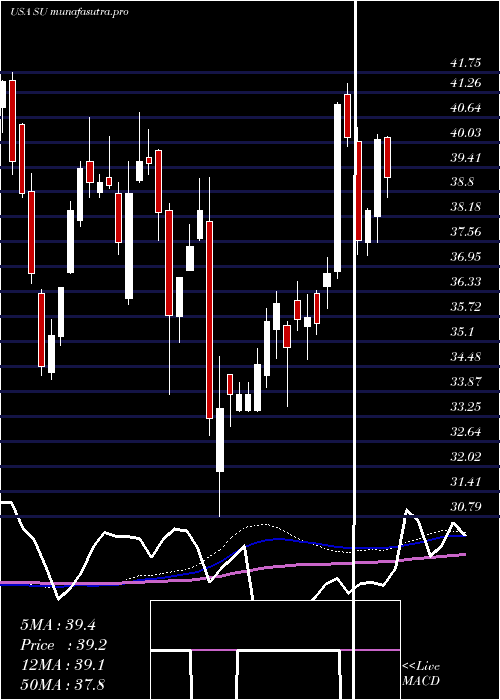
Weekly price and charts SuncorEnergy Strong weekly Stock price targets for SuncorEnergy SU are 43.39 and 45.13 | Weekly Target 1 | 42.92 | | Weekly Target 2 | 43.85 | | Weekly Target 3 | 44.663333333333 | | Weekly Target 4 | 45.59 | | Weekly Target 5 | 46.4 |
Weekly price and volumes for Suncor Energy
| Date |
Closing |
Open |
Range |
Volume |
Thu 04 December 2025 |
44.77 (-0.02%) |
45.23 |
43.74 - 45.48 |
1.0058 times |
Fri 28 November 2025 |
44.78 (1.04%) |
44.32 |
43.55 - 45.18 |
0.682 times |
Fri 21 November 2025 |
44.32 (-0.09%) |
44.28 |
43.89 - 45.60 |
1.0229 times |
Fri 14 November 2025 |
44.36 (4.08%) |
42.74 |
42.26 - 44.70 |
1.5177 times |
Fri 07 November 2025 |
42.62 (7.06%) |
39.10 |
38.72 - 42.72 |
1.3503 times |
Fri 31 October 2025 |
39.81 (0%) |
39.92 |
39.57 - 40.27 |
0.1828 times |
Fri 31 October 2025 |
39.81 (-0.05%) |
39.94 |
39.53 - 40.33 |
0.8271 times |
Fri 24 October 2025 |
39.83 (3.21%) |
38.65 |
37.77 - 40.35 |
1.2139 times |
Fri 17 October 2025 |
38.59 (-2.28%) |
39.91 |
38.35 - 40.05 |
0.8894 times |
Fri 10 October 2025 |
39.49 (-4.5%) |
41.97 |
39.36 - 41.97 |
1.3081 times |
Fri 03 October 2025 |
41.35 (-2.98%) |
42.34 |
41.06 - 42.41 |
0.8622 times |
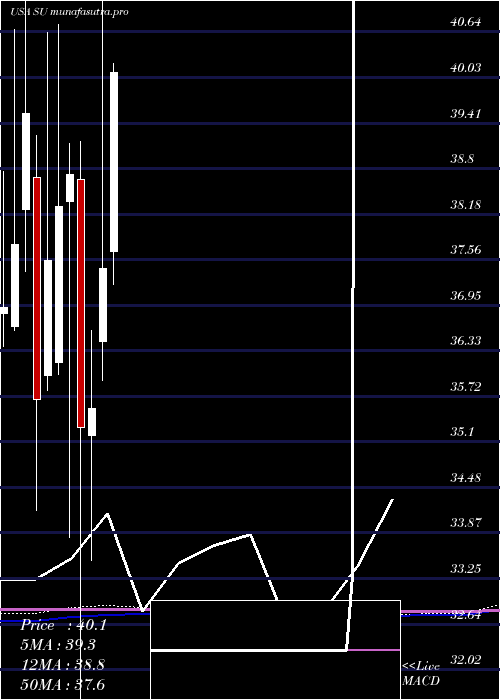
Monthly price and charts SuncorEnergy Strong monthly Stock price targets for SuncorEnergy SU are 43.39 and 45.13 | Monthly Target 1 | 42.92 | | Monthly Target 2 | 43.85 | | Monthly Target 3 | 44.663333333333 | | Monthly Target 4 | 45.59 | | Monthly Target 5 | 46.4 |
Monthly price and volumes Suncor Energy
| Date |
Closing |
Open |
Range |
Volume |
Thu 04 December 2025 |
44.77 (-0.02%) |
45.23 |
43.74 - 45.48 |
0.188 times |
Fri 28 November 2025 |
44.78 (12.48%) |
39.10 |
38.72 - 45.60 |
0.8547 times |
Fri 31 October 2025 |
39.81 (-4.78%) |
41.73 |
37.77 - 41.98 |
0.9057 times |
Tue 30 September 2025 |
41.81 (1.23%) |
41.27 |
39.59 - 43.48 |
1.1079 times |
Fri 29 August 2025 |
41.30 (4.66%) |
39.31 |
38.25 - 41.76 |
0.9468 times |
Thu 31 July 2025 |
39.46 (5.37%) |
37.68 |
37.23 - 40.22 |
0.8818 times |
Mon 30 June 2025 |
37.45 (5.34%) |
36.46 |
35.93 - 41.48 |
1.4427 times |
Fri 30 May 2025 |
35.55 (0.74%) |
35.18 |
33.50 - 36.60 |
1.1866 times |
Wed 30 April 2025 |
35.29 (-8.86%) |
38.65 |
30.79 - 39.16 |
1.1992 times |
Mon 31 March 2025 |
38.72 (1.15%) |
38.35 |
33.81 - 39.13 |
1.2866 times |
Fri 28 February 2025 |
38.28 (1.92%) |
36.18 |
36.01 - 40.75 |
1.0359 times |
DMA SMA EMA moving averages of Suncor Energy SU
DMA (daily moving average) of Suncor Energy SU
| DMA period | DMA value | | 5 day DMA | 44.59 | | 12 day DMA | 44.6 | | 20 day DMA | 44.18 | | 35 day DMA | 42.16 | | 50 day DMA | 41.81 | | 100 day DMA | 41.02 | | 150 day DMA | 39.74 | | 200 day DMA | 38.84 | EMA (exponential moving average) of Suncor Energy SU
| EMA period | EMA current | EMA prev | EMA prev2 | | 5 day EMA | 44.58 | 44.49 | 44.39 | | 12 day EMA | 44.33 | 44.25 | 44.17 | | 20 day EMA | 43.82 | 43.72 | 43.62 | | 35 day EMA | 43.12 | 43.02 | 42.92 | | 50 day EMA | 42.11 | 42 | 41.89 |
SMA (simple moving average) of Suncor Energy SU
| SMA period | SMA current | SMA prev | SMA prev2 | | 5 day SMA | 44.59 | 44.53 | 44.45 | | 12 day SMA | 44.6 | 44.57 | 44.54 | | 20 day SMA | 44.18 | 44 | 43.74 | | 35 day SMA | 42.16 | 42 | 41.84 | | 50 day SMA | 41.81 | 41.76 | 41.71 | | 100 day SMA | 41.02 | 40.96 | 40.92 | | 150 day SMA | 39.74 | 39.68 | 39.62 | | 200 day SMA | 38.84 | 38.82 | 38.79 |
|
|
