StarwoodProperty STWD full analysis,charts,indicators,moving averages,SMA,DMA,EMA,ADX,MACD,RSIStarwood Property STWD WideScreen charts, DMA,SMA,EMA technical analysis, forecast prediction, by indicators ADX,MACD,RSI,CCI USA stock exchange
operates under Consumer Services sector & deals in Real Estate Investment Trusts
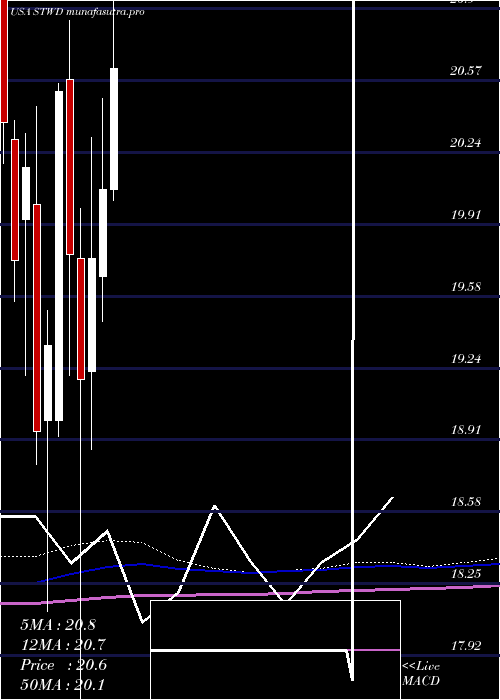
Daily price and charts and targets StarwoodProperty Strong Daily Stock price targets for StarwoodProperty STWD are 18.59 and 18.79 | Daily Target 1 | 18.42 | | Daily Target 2 | 18.55 | | Daily Target 3 | 18.623333333333 | | Daily Target 4 | 18.75 | | Daily Target 5 | 18.82 |
Daily price and volume Starwood Property
| Date |
Closing |
Open |
Range |
Volume |
Mon 20 October 2025 |
18.67 (0.65%) |
18.56 |
18.50 - 18.70 |
0.5427 times |
Fri 17 October 2025 |
18.55 (1.2%) |
18.37 |
18.35 - 18.57 |
0.8788 times |
Thu 16 October 2025 |
18.33 (-1.93%) |
18.70 |
18.33 - 18.79 |
1.1349 times |
Wed 15 October 2025 |
18.69 (-1.11%) |
19.06 |
18.69 - 19.06 |
1.2802 times |
Tue 14 October 2025 |
18.90 (0.96%) |
18.66 |
18.64 - 18.97 |
1.1064 times |
Mon 13 October 2025 |
18.72 (-1.06%) |
18.45 |
18.45 - 18.73 |
0.947 times |
Tue 07 October 2025 |
18.92 (-1.05%) |
18.99 |
18.89 - 19.05 |
1.0506 times |
Mon 06 October 2025 |
19.12 (-1.6%) |
19.50 |
18.99 - 19.54 |
1.3301 times |
Fri 03 October 2025 |
19.43 (-0.61%) |
19.46 |
19.38 - 19.57 |
0.9447 times |
Thu 02 October 2025 |
19.55 (0.41%) |
19.49 |
19.24 - 19.55 |
0.7846 times |
Wed 01 October 2025 |
19.47 (0.52%) |
19.34 |
19.32 - 19.55 |
1.3265 times |
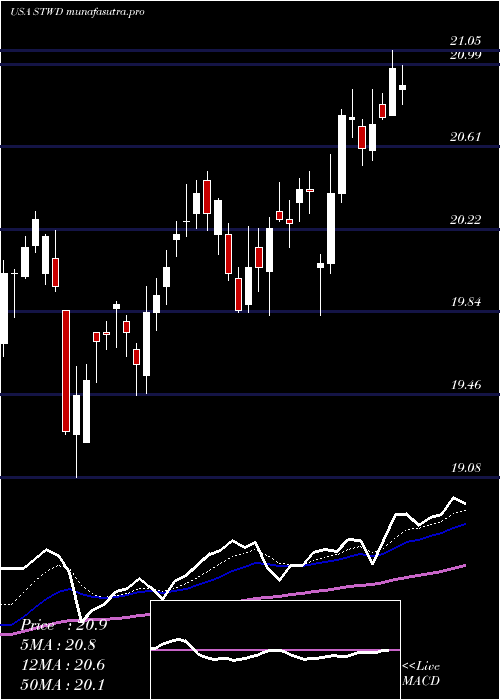
Weekly price and charts StarwoodProperty Strong weekly Stock price targets for StarwoodProperty STWD are 18.59 and 18.79 | Weekly Target 1 | 18.42 | | Weekly Target 2 | 18.55 | | Weekly Target 3 | 18.623333333333 | | Weekly Target 4 | 18.75 | | Weekly Target 5 | 18.82 |
Weekly price and volumes for Starwood Property
| Date |
Closing |
Open |
Range |
Volume |
Mon 20 October 2025 |
18.67 (0.65%) |
18.56 |
18.50 - 18.70 |
0.1459 times |
Fri 17 October 2025 |
18.55 (-1.96%) |
18.45 |
18.33 - 19.06 |
1.438 times |
Tue 07 October 2025 |
18.92 (-2.62%) |
19.50 |
18.89 - 19.54 |
0.6402 times |
Fri 03 October 2025 |
19.43 (-3.09%) |
20.05 |
19.22 - 20.07 |
1.5183 times |
Fri 26 September 2025 |
20.05 (-0.89%) |
20.19 |
19.82 - 20.21 |
1.4167 times |
Fri 19 September 2025 |
20.23 (-1.27%) |
20.62 |
20.14 - 20.62 |
1.3197 times |
Fri 12 September 2025 |
20.49 (-0.53%) |
20.50 |
20.33 - 20.84 |
1.3447 times |
Fri 05 September 2025 |
20.60 (1.63%) |
20.10 |
20.01 - 20.72 |
0.8148 times |
Fri 29 August 2025 |
20.27 (0%) |
20.10 |
20.10 - 20.30 |
0.2172 times |
Fri 29 August 2025 |
20.27 (0.1%) |
20.27 |
20.02 - 20.30 |
1.1444 times |
Fri 22 August 2025 |
20.25 (1.91%) |
19.86 |
19.81 - 20.30 |
1.0274 times |
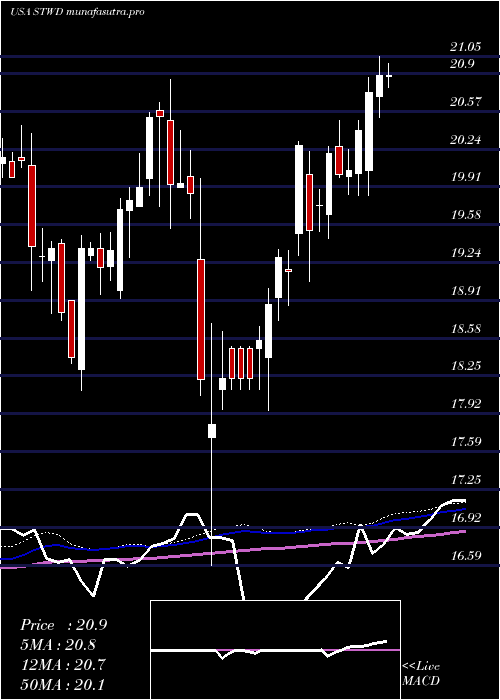
Monthly price and charts StarwoodProperty Strong monthly Stock price targets for StarwoodProperty STWD are 17.88 and 19.12 | Monthly Target 1 | 17.62 | | Monthly Target 2 | 18.14 | | Monthly Target 3 | 18.856666666667 | | Monthly Target 4 | 19.38 | | Monthly Target 5 | 20.1 |
Monthly price and volumes Starwood Property
| Date |
Closing |
Open |
Range |
Volume |
Mon 20 October 2025 |
18.67 (-3.61%) |
19.34 |
18.33 - 19.57 |
0.5731 times |
Tue 30 September 2025 |
19.37 (-4.44%) |
20.10 |
19.22 - 20.84 |
1.0522 times |
Fri 29 August 2025 |
20.27 (4.16%) |
19.45 |
19.24 - 20.30 |
0.9946 times |
Thu 31 July 2025 |
19.46 (-3.04%) |
20.07 |
19.38 - 21.05 |
2.0125 times |
Mon 30 June 2025 |
20.07 (1.62%) |
19.67 |
19.46 - 20.49 |
0.7392 times |
Fri 30 May 2025 |
19.75 (2.92%) |
19.23 |
18.87 - 20.31 |
0.8744 times |
Wed 30 April 2025 |
19.19 (-2.93%) |
19.75 |
16.59 - 19.98 |
1.3661 times |
Mon 31 March 2025 |
19.77 (-3.65%) |
20.58 |
19.21 - 20.85 |
0.8792 times |
Fri 28 February 2025 |
20.52 (6.05%) |
19.00 |
18.93 - 20.56 |
0.6835 times |
Fri 31 January 2025 |
19.35 (2.11%) |
19.00 |
18.12 - 19.51 |
0.8251 times |
Tue 31 December 2024 |
18.95 (-6.05%) |
20.00 |
18.80 - 20.45 |
0.6869 times |
DMA SMA EMA moving averages of Starwood Property STWD
DMA (daily moving average) of Starwood Property STWD
| DMA period | DMA value | | 5 day DMA | 18.63 | | 12 day DMA | 18.98 | | 20 day DMA | 19.41 | | 35 day DMA | 19.83 | | 50 day DMA | 19.87 | | 100 day DMA | 19.98 | | 150 day DMA | 19.71 | | 200 day DMA | 19.66 | EMA (exponential moving average) of Starwood Property STWD
| EMA period | EMA current | EMA prev | EMA prev2 | | 5 day EMA | 18.66 | 18.66 | 18.71 | | 12 day EMA | 18.97 | 19.03 | 19.12 | | 20 day EMA | 19.25 | 19.31 | 19.39 | | 35 day EMA | 19.49 | 19.54 | 19.6 | | 50 day EMA | 19.72 | 19.76 | 19.81 |
SMA (simple moving average) of Starwood Property STWD
| SMA period | SMA current | SMA prev | SMA prev2 | | 5 day SMA | 18.63 | 18.64 | 18.71 | | 12 day SMA | 18.98 | 19.08 | 19.21 | | 20 day SMA | 19.41 | 19.49 | 19.57 | | 35 day SMA | 19.83 | 19.87 | 19.92 | | 50 day SMA | 19.87 | 19.89 | 19.91 | | 100 day SMA | 19.98 | 19.99 | 20 | | 150 day SMA | 19.71 | 19.71 | 19.72 | | 200 day SMA | 19.66 | 19.66 | 19.67 |
|
|
