StateStreet STT full analysis,charts,indicators,moving averages,SMA,DMA,EMA,ADX,MACD,RSIState Street STT WideScreen charts, DMA,SMA,EMA technical analysis, forecast prediction, by indicators ADX,MACD,RSI,CCI USA stock exchange
operates under Finance sector & deals in Major Banks
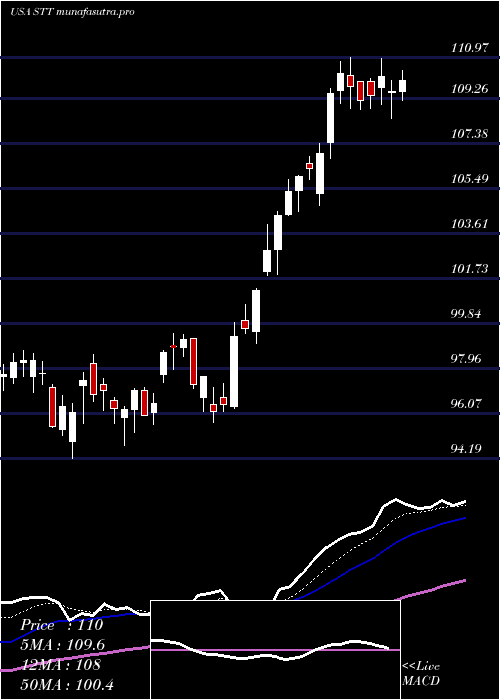
Daily price and charts and targets StateStreet Strong Daily Stock price targets for StateStreet STT are 121.19 and 123.31 | Daily Target 1 | 119.54 | | Daily Target 2 | 120.71 | | Daily Target 3 | 121.66333333333 | | Daily Target 4 | 122.83 | | Daily Target 5 | 123.78 |
Daily price and volume State Street
| Date |
Closing |
Open |
Range |
Volume |
Thu 04 December 2025 |
121.87 (0.8%) |
120.74 |
120.50 - 122.62 |
1.2232 times |
Wed 03 December 2025 |
120.90 (1.58%) |
118.99 |
118.99 - 121.04 |
1.0573 times |
Tue 02 December 2025 |
119.02 (0.76%) |
119.01 |
118.22 - 119.94 |
0.7942 times |
Mon 01 December 2025 |
118.12 (-0.76%) |
117.90 |
117.68 - 119.29 |
0.9751 times |
Fri 28 November 2025 |
119.02 (1.16%) |
118.19 |
118.08 - 119.39 |
0.3156 times |
Wed 26 November 2025 |
117.66 (1.35%) |
116.30 |
116.14 - 118.44 |
0.6814 times |
Tue 25 November 2025 |
116.09 (0.86%) |
115.12 |
114.54 - 116.68 |
1.1025 times |
Mon 24 November 2025 |
115.10 (0.65%) |
114.52 |
113.62 - 115.71 |
1.6002 times |
Fri 21 November 2025 |
114.36 (0.94%) |
113.93 |
112.82 - 115.98 |
1.4157 times |
Thu 20 November 2025 |
113.30 (-0.61%) |
115.46 |
113.08 - 116.61 |
0.8348 times |
Wed 19 November 2025 |
114.00 (0.71%) |
113.28 |
113.00 - 114.35 |
0.5323 times |
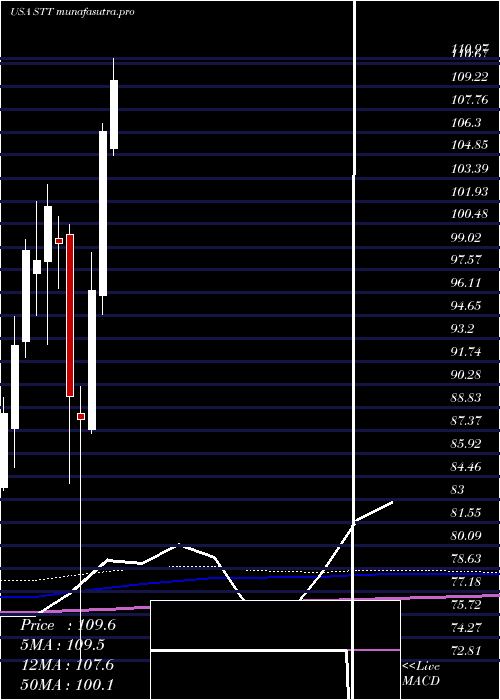
Weekly price and charts StateStreet Strong weekly Stock price targets for StateStreet STT are 119.78 and 124.72 | Weekly Target 1 | 115.78 | | Weekly Target 2 | 118.83 | | Weekly Target 3 | 120.72333333333 | | Weekly Target 4 | 123.77 | | Weekly Target 5 | 125.66 |
Weekly price and volumes for State Street
| Date |
Closing |
Open |
Range |
Volume |
Thu 04 December 2025 |
121.87 (2.39%) |
117.90 |
117.68 - 122.62 |
0.7582 times |
Fri 28 November 2025 |
119.02 (4.07%) |
114.52 |
113.62 - 119.39 |
0.6927 times |
Fri 21 November 2025 |
114.36 (-2.12%) |
116.46 |
111.63 - 116.61 |
0.9323 times |
Fri 14 November 2025 |
116.84 (-1.24%) |
118.72 |
116.49 - 122.69 |
0.8285 times |
Fri 07 November 2025 |
118.31 (2.29%) |
114.99 |
114.72 - 118.50 |
0.8329 times |
Fri 31 October 2025 |
115.66 (0%) |
114.48 |
113.83 - 116.11 |
0.2764 times |
Fri 31 October 2025 |
115.66 (-0.4%) |
116.93 |
113.83 - 119.33 |
1.6821 times |
Fri 24 October 2025 |
116.12 (4.27%) |
112.31 |
112.13 - 117.39 |
1.6233 times |
Fri 17 October 2025 |
111.37 (0.33%) |
112.30 |
104.64 - 118.00 |
1.3882 times |
Fri 10 October 2025 |
111.00 (-4.62%) |
116.51 |
110.87 - 118.24 |
0.9853 times |
Fri 03 October 2025 |
116.38 (0.58%) |
116.30 |
112.79 - 118.06 |
0.8656 times |
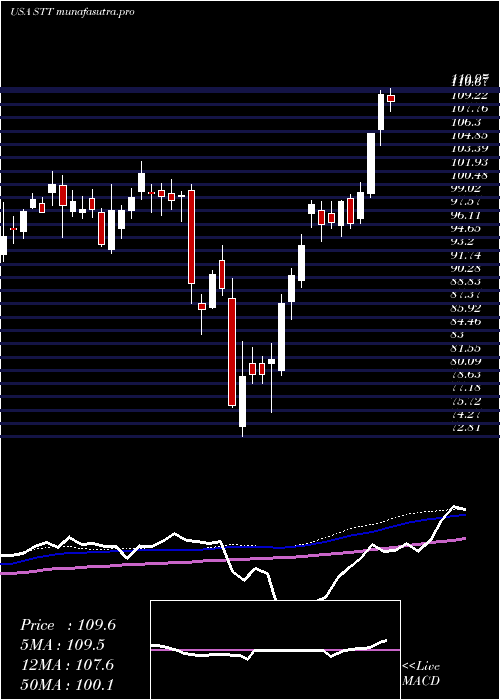
Monthly price and charts StateStreet Strong monthly Stock price targets for StateStreet STT are 119.78 and 124.72 | Monthly Target 1 | 115.78 | | Monthly Target 2 | 118.83 | | Monthly Target 3 | 120.72333333333 | | Monthly Target 4 | 123.77 | | Monthly Target 5 | 125.66 |
Monthly price and volumes State Street
| Date |
Closing |
Open |
Range |
Volume |
Thu 04 December 2025 |
121.87 (2.39%) |
117.90 |
117.68 - 122.62 |
0.166 times |
Fri 28 November 2025 |
119.02 (2.91%) |
114.99 |
111.63 - 122.69 |
0.7194 times |
Fri 31 October 2025 |
115.66 (-0.3%) |
114.61 |
104.64 - 119.33 |
1.4152 times |
Tue 30 September 2025 |
116.01 (0.9%) |
113.60 |
110.32 - 118.06 |
0.9555 times |
Fri 29 August 2025 |
114.97 (2.88%) |
109.99 |
107.34 - 116.37 |
0.8571 times |
Thu 31 July 2025 |
111.75 (5.09%) |
105.27 |
101.98 - 114.28 |
1.3788 times |
Mon 30 June 2025 |
106.34 (10.45%) |
95.92 |
94.72 - 106.83 |
0.9506 times |
Fri 30 May 2025 |
96.28 (9.28%) |
87.47 |
87.22 - 98.69 |
0.971 times |
Wed 30 April 2025 |
88.10 (-1.6%) |
88.48 |
72.81 - 90.18 |
1.4296 times |
Mon 31 March 2025 |
89.53 (-9.78%) |
99.79 |
84.03 - 100.47 |
1.1569 times |
Fri 28 February 2025 |
99.23 (-2.35%) |
99.57 |
96.42 - 100.97 |
0.9342 times |
DMA SMA EMA moving averages of State Street STT
DMA (daily moving average) of State Street STT
| DMA period | DMA value | | 5 day DMA | 119.79 | | 12 day DMA | 116.89 | | 20 day DMA | 117.32 | | 35 day DMA | 116.51 | | 50 day DMA | 116.22 | | 100 day DMA | 114.09 | | 150 day DMA | 109.27 | | 200 day DMA | 103.98 | EMA (exponential moving average) of State Street STT
| EMA period | EMA current | EMA prev | EMA prev2 | | 5 day EMA | 119.9 | 118.91 | 117.91 | | 12 day EMA | 118.23 | 117.57 | 116.97 | | 20 day EMA | 117.51 | 117.05 | 116.65 | | 35 day EMA | 116.79 | 116.49 | 116.23 | | 50 day EMA | 116.35 | 116.12 | 115.92 |
SMA (simple moving average) of State Street STT
| SMA period | SMA current | SMA prev | SMA prev2 | | 5 day SMA | 119.79 | 118.94 | 117.98 | | 12 day SMA | 116.89 | 116.13 | 115.8 | | 20 day SMA | 117.32 | 117.07 | 116.83 | | 35 day SMA | 116.51 | 116.37 | 116.21 | | 50 day SMA | 116.22 | 116.04 | 115.88 | | 100 day SMA | 114.09 | 113.89 | 113.78 | | 150 day SMA | 109.27 | 109.04 | 108.83 | | 200 day SMA | 103.98 | 103.87 | 103.76 |
|
|
