StantecInc STN full analysis,charts,indicators,moving averages,SMA,DMA,EMA,ADX,MACD,RSIStantec Inc STN WideScreen charts, DMA,SMA,EMA technical analysis, forecast prediction, by indicators ADX,MACD,RSI,CCI USA stock exchange
operates under Consumer Services sector & deals in Military Government Technical
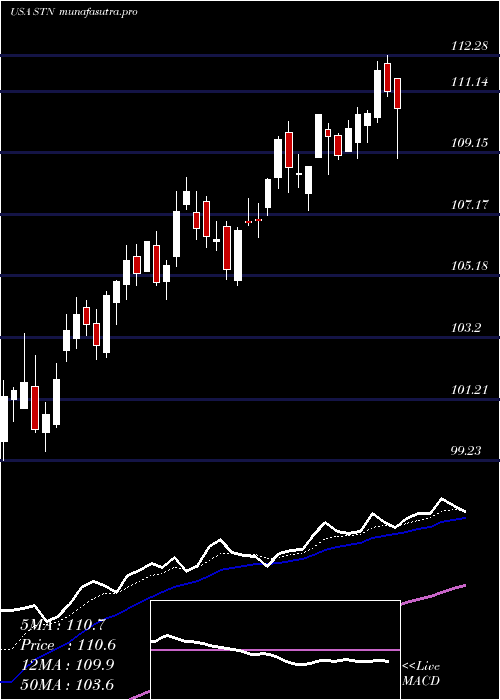
Daily price and charts and targets StantecInc Strong Daily Stock price targets for StantecInc STN are 111.27 and 112.75 | Daily Target 1 | 110.07 | | Daily Target 2 | 110.99 | | Daily Target 3 | 111.55 | | Daily Target 4 | 112.47 | | Daily Target 5 | 113.03 |
Daily price and volume Stantec Inc
| Date |
Closing |
Open |
Range |
Volume |
Mon 20 October 2025 |
111.91 (1.67%) |
110.71 |
110.63 - 112.11 |
0.6665 times |
Fri 17 October 2025 |
110.07 (-0.21%) |
110.00 |
109.25 - 110.24 |
1.4164 times |
Thu 16 October 2025 |
110.30 (-1.7%) |
112.88 |
110.17 - 112.88 |
1.0699 times |
Wed 15 October 2025 |
112.21 (-0.34%) |
113.00 |
110.94 - 113.87 |
0.7984 times |
Tue 14 October 2025 |
112.59 (1.57%) |
109.89 |
109.86 - 112.73 |
1.231 times |
Mon 13 October 2025 |
110.85 (1.39%) |
109.85 |
109.78 - 111.08 |
0.3138 times |
Fri 10 October 2025 |
109.33 (-1.59%) |
111.57 |
109.32 - 111.57 |
1.038 times |
Thu 09 October 2025 |
111.10 (-1.76%) |
113.52 |
110.98 - 113.52 |
0.82 times |
Wed 08 October 2025 |
113.09 (1.75%) |
111.21 |
111.07 - 113.14 |
1.7434 times |
Tue 07 October 2025 |
111.14 (0.06%) |
111.10 |
110.39 - 111.72 |
0.9026 times |
Mon 06 October 2025 |
111.07 (0.54%) |
111.01 |
110.37 - 112.01 |
0.9651 times |
Weekly price and charts StantecInc Strong weekly Stock price targets for StantecInc STN are 111.27 and 112.75 | Weekly Target 1 | 110.07 | | Weekly Target 2 | 110.99 | | Weekly Target 3 | 111.55 | | Weekly Target 4 | 112.47 | | Weekly Target 5 | 113.03 |
Weekly price and volumes for Stantec Inc
| Date |
Closing |
Open |
Range |
Volume |
Mon 20 October 2025 |
111.91 (1.67%) |
110.71 |
110.63 - 112.11 |
0.1387 times |
Fri 17 October 2025 |
110.07 (0.68%) |
109.85 |
109.25 - 113.87 |
1.005 times |
Fri 10 October 2025 |
109.33 (-1.03%) |
111.01 |
109.32 - 113.52 |
1.1381 times |
Fri 03 October 2025 |
110.47 (4%) |
106.22 |
105.45 - 110.73 |
0.9668 times |
Fri 26 September 2025 |
106.22 (-3.1%) |
109.01 |
105.76 - 112.10 |
1.6149 times |
Fri 19 September 2025 |
109.62 (-0.8%) |
111.04 |
108.64 - 111.09 |
1.9816 times |
Fri 12 September 2025 |
110.50 (2.27%) |
108.11 |
106.82 - 112.33 |
1.3029 times |
Fri 05 September 2025 |
108.05 (-0.57%) |
107.80 |
107.15 - 109.99 |
0.7153 times |
Fri 29 August 2025 |
108.67 (0%) |
110.27 |
108.60 - 110.51 |
0.1701 times |
Fri 29 August 2025 |
108.67 (-1.91%) |
110.70 |
108.20 - 110.70 |
0.9666 times |
Fri 22 August 2025 |
110.79 (4.29%) |
106.35 |
105.51 - 110.89 |
1.3645 times |
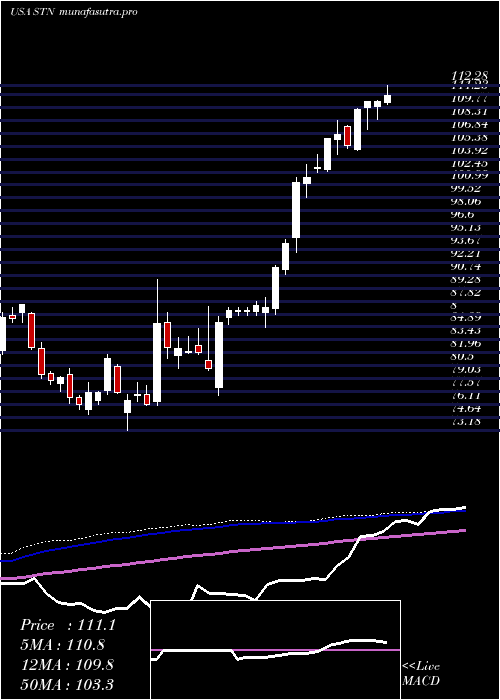
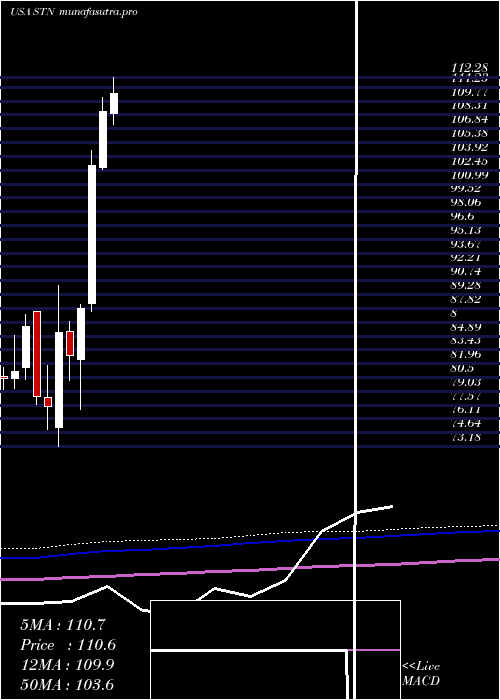
Monthly price and charts StantecInc Strong monthly Stock price targets for StantecInc STN are 109.57 and 116.21 | Monthly Target 1 | 104.36 | | Monthly Target 2 | 108.14 | | Monthly Target 3 | 111.00333333333 | | Monthly Target 4 | 114.78 | | Monthly Target 5 | 117.64 |
Monthly price and volumes Stantec Inc
| Date |
Closing |
Open |
Range |
Volume |
Mon 20 October 2025 |
111.91 (3.81%) |
107.23 |
107.23 - 113.87 |
0.555 times |
Tue 30 September 2025 |
107.80 (-0.8%) |
107.80 |
105.45 - 112.33 |
1.2461 times |
Fri 29 August 2025 |
108.67 (-0.63%) |
108.53 |
98.00 - 112.12 |
1.2606 times |
Thu 31 July 2025 |
109.36 (0.63%) |
108.44 |
107.28 - 113.50 |
0.9836 times |
Mon 30 June 2025 |
108.68 (5.58%) |
102.71 |
102.54 - 110.17 |
1.0122 times |
Fri 30 May 2025 |
102.94 (17.24%) |
88.35 |
87.46 - 104.49 |
1.2656 times |
Wed 30 April 2025 |
87.80 (5.99%) |
82.46 |
77.07 - 88.28 |
1.018 times |
Mon 31 March 2025 |
82.84 (-2.86%) |
85.36 |
80.16 - 86.48 |
0.9482 times |
Fri 28 February 2025 |
85.28 (10.14%) |
75.24 |
73.18 - 90.24 |
1.0273 times |
Fri 31 January 2025 |
77.43 (-1.3%) |
78.42 |
74.98 - 81.82 |
0.6832 times |
Tue 31 December 2024 |
78.45 (-8.65%) |
87.47 |
77.61 - 87.47 |
0.4664 times |
DMA SMA EMA moving averages of Stantec Inc STN
DMA (daily moving average) of Stantec Inc STN
| DMA period | DMA value | | 5 day DMA | 111.42 | | 12 day DMA | 111.18 | | 20 day DMA | 109.68 | | 35 day DMA | 109.6 | | 50 day DMA | 109.17 | | 100 day DMA | 108.77 | | 150 day DMA | 102.16 | | 200 day DMA | 96.42 | EMA (exponential moving average) of Stantec Inc STN
| EMA period | EMA current | EMA prev | EMA prev2 | | 5 day EMA | 111.17 | 110.8 | 111.17 | | 12 day EMA | 110.79 | 110.59 | 110.68 | | 20 day EMA | 110.36 | 110.2 | 110.21 | | 35 day EMA | 109.79 | 109.67 | 109.65 | | 50 day EMA | 109.44 | 109.34 | 109.31 |
SMA (simple moving average) of Stantec Inc STN
| SMA period | SMA current | SMA prev | SMA prev2 | | 5 day SMA | 111.42 | 111.2 | 111.06 | | 12 day SMA | 111.18 | 110.94 | 110.85 | | 20 day SMA | 109.68 | 109.68 | 109.66 | | 35 day SMA | 109.6 | 109.5 | 109.46 | | 50 day SMA | 109.17 | 109.11 | 109.1 | | 100 day SMA | 108.77 | 108.68 | 108.6 | | 150 day SMA | 102.16 | 101.97 | 101.77 | | 200 day SMA | 96.42 | 96.25 | 96.09 |
|
|
