OneGroup STKS full analysis,charts,indicators,moving averages,SMA,DMA,EMA,ADX,MACD,RSIOne Group STKS WideScreen charts, DMA,SMA,EMA technical analysis, forecast prediction, by indicators ADX,MACD,RSI,CCI USA stock exchange
operates under Consumer Services sector & deals in Restaurants
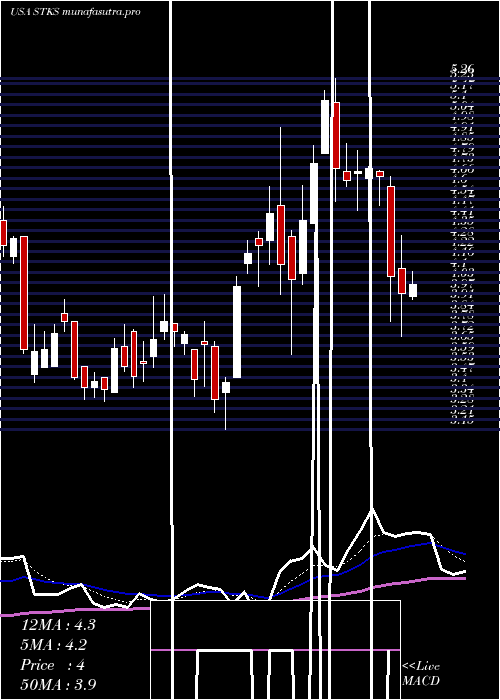
Daily price and charts and targets OneGroup Strong Daily Stock price targets for OneGroup STKS are 2.46 and 2.54 | Daily Target 1 | 2.44 | | Daily Target 2 | 2.48 | | Daily Target 3 | 2.5233333333333 | | Daily Target 4 | 2.56 | | Daily Target 5 | 2.6 |
Daily price and volume One Group
| Date |
Closing |
Open |
Range |
Volume |
Tue 21 October 2025 |
2.51 (-1.95%) |
2.56 |
2.49 - 2.57 |
0.49 times |
Mon 20 October 2025 |
2.56 (-1.16%) |
2.62 |
2.53 - 2.69 |
0.6518 times |
Fri 17 October 2025 |
2.59 (0.78%) |
2.52 |
2.52 - 2.67 |
1.3491 times |
Thu 16 October 2025 |
2.57 (-6.55%) |
2.79 |
2.53 - 2.79 |
0.5309 times |
Wed 15 October 2025 |
2.75 (-2.14%) |
2.85 |
2.74 - 2.90 |
0.6639 times |
Tue 14 October 2025 |
2.81 (9.77%) |
2.53 |
2.51 - 2.91 |
2.1295 times |
Mon 13 October 2025 |
2.56 (3.23%) |
2.54 |
2.50 - 2.58 |
0.7592 times |
Fri 10 October 2025 |
2.48 (0.81%) |
2.45 |
2.40 - 2.51 |
1.1721 times |
Thu 09 October 2025 |
2.46 (-3.53%) |
2.59 |
2.36 - 2.63 |
1.6727 times |
Wed 08 October 2025 |
2.55 (-0.39%) |
2.56 |
2.53 - 2.65 |
0.5808 times |
Tue 07 October 2025 |
2.56 (1.59%) |
2.55 |
2.41 - 2.57 |
1.337 times |
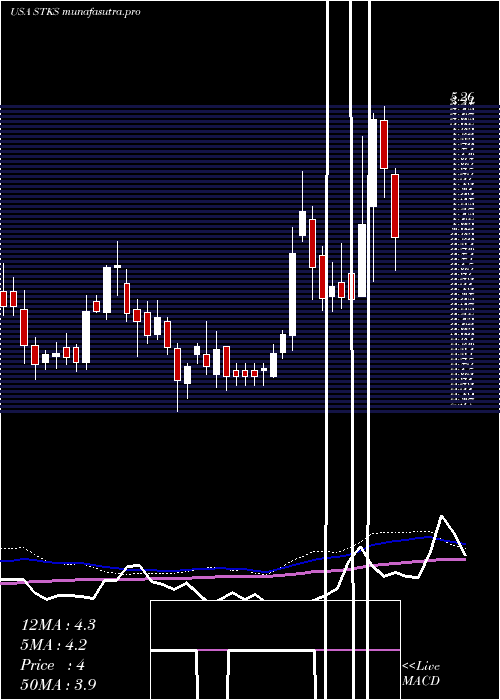
Weekly price and charts OneGroup Strong weekly Stock price targets for OneGroup STKS are 2.4 and 2.6 | Weekly Target 1 | 2.36 | | Weekly Target 2 | 2.44 | | Weekly Target 3 | 2.5633333333333 | | Weekly Target 4 | 2.64 | | Weekly Target 5 | 2.76 |
Weekly price and volumes for One Group
| Date |
Closing |
Open |
Range |
Volume |
Tue 21 October 2025 |
2.51 (-3.09%) |
2.62 |
2.49 - 2.69 |
0.166 times |
Fri 17 October 2025 |
2.59 (4.44%) |
2.54 |
2.50 - 2.91 |
0.7896 times |
Fri 10 October 2025 |
2.48 (-0.4%) |
2.50 |
2.36 - 2.65 |
0.8399 times |
Fri 03 October 2025 |
2.49 (1.22%) |
2.49 |
2.34 - 3.38 |
4.0606 times |
Fri 26 September 2025 |
2.46 (-0.4%) |
2.50 |
2.31 - 2.61 |
0.8944 times |
Fri 19 September 2025 |
2.47 (-5.73%) |
2.62 |
2.44 - 2.71 |
0.9969 times |
Fri 12 September 2025 |
2.62 (-4.73%) |
2.75 |
2.43 - 2.77 |
0.9481 times |
Fri 05 September 2025 |
2.75 (-1.43%) |
2.72 |
2.64 - 2.81 |
0.4631 times |
Fri 29 August 2025 |
2.79 (0%) |
2.79 |
2.72 - 2.85 |
0.1611 times |
Fri 29 August 2025 |
2.79 (-1.76%) |
2.87 |
2.72 - 2.96 |
0.6803 times |
Fri 22 August 2025 |
2.84 (5.97%) |
2.70 |
2.63 - 2.96 |
0.6856 times |
Monthly price and charts OneGroup Strong monthly Stock price targets for OneGroup STKS are 2.13 and 2.72 | Monthly Target 1 | 2 | | Monthly Target 2 | 2.26 | | Monthly Target 3 | 2.5933333333333 | | Monthly Target 4 | 2.85 | | Monthly Target 5 | 3.18 |
Monthly price and volumes One Group
| Date |
Closing |
Open |
Range |
Volume |
Tue 21 October 2025 |
2.51 (-15.2%) |
2.89 |
2.34 - 2.93 |
0.6998 times |
Tue 30 September 2025 |
2.96 (6.09%) |
2.72 |
2.31 - 3.38 |
1.1337 times |
Fri 29 August 2025 |
2.79 (-6.69%) |
2.96 |
2.60 - 3.19 |
0.8011 times |
Thu 31 July 2025 |
2.99 (-26.17%) |
4.09 |
2.98 - 5.26 |
1.7611 times |
Mon 30 June 2025 |
4.05 (17.73%) |
3.46 |
3.15 - 4.97 |
1.9947 times |
Fri 30 May 2025 |
3.44 (14.29%) |
3.02 |
2.95 - 4.64 |
0.5907 times |
Wed 30 April 2025 |
3.01 (0.67%) |
2.96 |
2.57 - 3.22 |
0.6951 times |
Mon 31 March 2025 |
2.99 (-8.28%) |
3.22 |
2.37 - 3.26 |
0.6178 times |
Fri 28 February 2025 |
3.26 (-13.07%) |
3.58 |
2.89 - 3.72 |
0.61 times |
Fri 31 January 2025 |
3.75 (29.31%) |
2.95 |
2.75 - 3.98 |
1.0962 times |
Tue 31 December 2024 |
2.90 (-13.95%) |
3.34 |
2.68 - 3.52 |
1.1132 times |
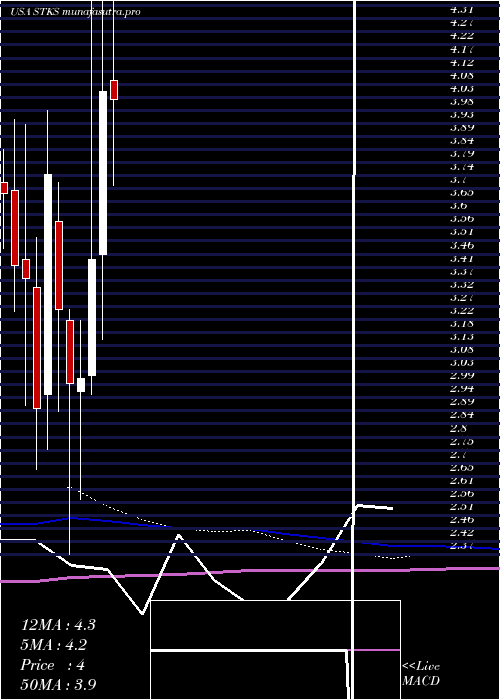
DMA SMA EMA moving averages of One Group STKS
DMA (daily moving average) of One Group STKS
| DMA period | DMA value | | 5 day DMA | 2.6 | | 12 day DMA | 2.58 | | 20 day DMA | 2.59 | | 35 day DMA | 2.6 | | 50 day DMA | 2.65 | | 100 day DMA | 3.18 | | 150 day DMA | 3.18 | | 200 day DMA | 3.19 | EMA (exponential moving average) of One Group STKS
| EMA period | EMA current | EMA prev | EMA prev2 | | 5 day EMA | 2.57 | 2.6 | 2.62 | | 12 day EMA | 2.58 | 2.59 | 2.6 | | 20 day EMA | 2.6 | 2.61 | 2.61 | | 35 day EMA | 2.63 | 2.64 | 2.64 | | 50 day EMA | 2.66 | 2.67 | 2.67 |
SMA (simple moving average) of One Group STKS
| SMA period | SMA current | SMA prev | SMA prev2 | | 5 day SMA | 2.6 | 2.66 | 2.66 | | 12 day SMA | 2.58 | 2.58 | 2.58 | | 20 day SMA | 2.59 | 2.59 | 2.58 | | 35 day SMA | 2.6 | 2.61 | 2.61 | | 50 day SMA | 2.65 | 2.65 | 2.66 | | 100 day SMA | 3.18 | 3.18 | 3.2 | | 150 day SMA | 3.18 | 3.18 | 3.18 | | 200 day SMA | 3.19 | 3.19 | 3.19 |
|
|
