StewartInformation STC full analysis,charts,indicators,moving averages,SMA,DMA,EMA,ADX,MACD,RSIStewart Information STC WideScreen charts, DMA,SMA,EMA technical analysis, forecast prediction, by indicators ADX,MACD,RSI,CCI USA stock exchange
operates under Finance sector & deals in Specialty Insurers
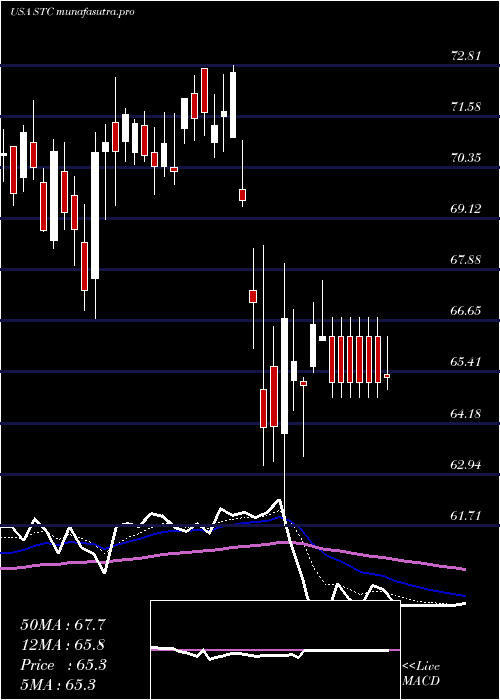
Daily price and charts and targets StewartInformation Strong Daily Stock price targets for StewartInformation STC are 70.37 and 72.04 | Daily Target 1 | 69.05 | | Daily Target 2 | 70.02 | | Daily Target 3 | 70.723333333333 | | Daily Target 4 | 71.69 | | Daily Target 5 | 72.39 |
Daily price and volume Stewart Information
| Date |
Closing |
Open |
Range |
Volume |
Mon 20 October 2025 |
70.98 (1.75%) |
70.22 |
69.76 - 71.43 |
1.6062 times |
Fri 17 October 2025 |
69.76 (1.32%) |
68.91 |
68.91 - 69.84 |
0.7848 times |
Thu 16 October 2025 |
68.85 (-1.73%) |
69.54 |
68.72 - 70.25 |
1.7383 times |
Wed 15 October 2025 |
70.06 (0.32%) |
69.78 |
68.83 - 70.41 |
1.3142 times |
Tue 14 October 2025 |
69.84 (2.89%) |
67.64 |
67.54 - 70.20 |
0.8975 times |
Mon 13 October 2025 |
67.88 (-0.25%) |
67.15 |
66.87 - 68.02 |
0.7265 times |
Tue 07 October 2025 |
68.05 (-2.42%) |
69.58 |
67.90 - 70.44 |
0.8348 times |
Mon 06 October 2025 |
69.74 (-3.73%) |
72.37 |
69.46 - 72.38 |
0.5228 times |
Fri 03 October 2025 |
72.44 (-0.07%) |
72.56 |
72.07 - 74.28 |
1.0327 times |
Thu 02 October 2025 |
72.49 (-0.4%) |
72.50 |
71.28 - 72.90 |
0.5422 times |
Wed 01 October 2025 |
72.78 (-0.74%) |
72.90 |
72.64 - 73.48 |
0.6601 times |
Weekly price and charts StewartInformation Strong weekly Stock price targets for StewartInformation STC are 70.37 and 72.04 | Weekly Target 1 | 69.05 | | Weekly Target 2 | 70.02 | | Weekly Target 3 | 70.723333333333 | | Weekly Target 4 | 71.69 | | Weekly Target 5 | 72.39 |
Weekly price and volumes for Stewart Information
| Date |
Closing |
Open |
Range |
Volume |
Mon 20 October 2025 |
70.98 (1.75%) |
70.22 |
69.76 - 71.43 |
0.3823 times |
Fri 17 October 2025 |
69.76 (2.51%) |
67.15 |
66.87 - 70.41 |
1.3 times |
Tue 07 October 2025 |
68.05 (-6.06%) |
72.37 |
67.90 - 72.38 |
0.3232 times |
Fri 03 October 2025 |
72.44 (-2.53%) |
74.19 |
71.28 - 74.47 |
0.9868 times |
Fri 26 September 2025 |
74.32 (-1.28%) |
75.27 |
72.72 - 75.99 |
0.9785 times |
Fri 19 September 2025 |
75.28 (1.09%) |
75.00 |
71.86 - 77.47 |
1.9935 times |
Fri 12 September 2025 |
74.47 (1.25%) |
73.25 |
71.32 - 75.22 |
1.4066 times |
Fri 05 September 2025 |
73.55 (0.97%) |
71.88 |
70.43 - 75.44 |
1.1535 times |
Fri 29 August 2025 |
72.84 (0%) |
73.07 |
72.59 - 73.86 |
0.2232 times |
Fri 29 August 2025 |
72.84 (-0.87%) |
72.90 |
71.96 - 73.89 |
1.2523 times |
Fri 22 August 2025 |
73.48 (3.79%) |
70.70 |
69.52 - 73.99 |
1.0184 times |
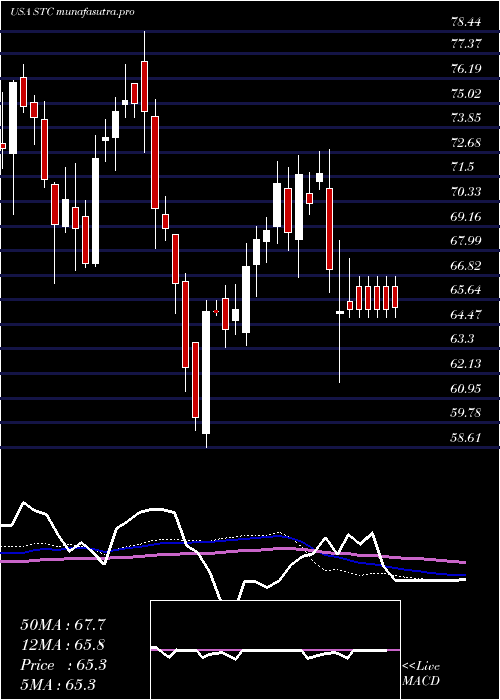
Monthly price and charts StewartInformation Strong monthly Stock price targets for StewartInformation STC are 65.22 and 72.63 | Monthly Target 1 | 63.3 | | Monthly Target 2 | 67.14 | | Monthly Target 3 | 70.71 | | Monthly Target 4 | 74.55 | | Monthly Target 5 | 78.12 |
Monthly price and volumes Stewart Information
| Date |
Closing |
Open |
Range |
Volume |
Mon 20 October 2025 |
70.98 (-3.19%) |
72.90 |
66.87 - 74.28 |
0.4099 times |
Tue 30 September 2025 |
73.32 (0.66%) |
71.88 |
70.43 - 77.47 |
0.9671 times |
Fri 29 August 2025 |
72.84 (12.18%) |
64.84 |
64.63 - 73.99 |
0.8731 times |
Thu 31 July 2025 |
64.93 (-0.26%) |
64.62 |
56.39 - 67.38 |
1.5418 times |
Mon 30 June 2025 |
65.10 (7.89%) |
60.11 |
58.64 - 66.07 |
0.9823 times |
Fri 30 May 2025 |
60.34 (-7.85%) |
65.37 |
59.25 - 67.01 |
0.9913 times |
Wed 30 April 2025 |
65.48 (-8.23%) |
71.57 |
61.71 - 72.81 |
0.8013 times |
Mon 31 March 2025 |
71.35 (0.21%) |
70.95 |
66.70 - 72.72 |
1.1015 times |
Fri 28 February 2025 |
71.20 (9.22%) |
64.09 |
63.46 - 72.23 |
1.0571 times |
Fri 31 January 2025 |
65.19 (-3.41%) |
67.54 |
58.61 - 68.50 |
1.2747 times |
Tue 31 December 2024 |
67.49 (-10.16%) |
74.99 |
67.27 - 78.44 |
0.868 times |

DMA SMA EMA moving averages of Stewart Information STC
DMA (daily moving average) of Stewart Information STC
| DMA period | DMA value | | 5 day DMA | 69.9 | | 12 day DMA | 70.52 | | 20 day DMA | 72.12 | | 35 day DMA | 72.65 | | 50 day DMA | 72.1 | | 100 day DMA | 67.38 | | 150 day DMA | 67.18 | | 200 day DMA | 67.05 | EMA (exponential moving average) of Stewart Information STC
| EMA period | EMA current | EMA prev | EMA prev2 | | 5 day EMA | 70.05 | 69.59 | 69.51 | | 12 day EMA | 70.62 | 70.55 | 70.69 | | 20 day EMA | 71.24 | 71.27 | 71.43 | | 35 day EMA | 71.39 | 71.41 | 71.51 | | 50 day EMA | 71.41 | 71.43 | 71.5 |
SMA (simple moving average) of Stewart Information STC
| SMA period | SMA current | SMA prev | SMA prev2 | | 5 day SMA | 69.9 | 69.28 | 68.94 | | 12 day SMA | 70.52 | 70.74 | 71.12 | | 20 day SMA | 72.12 | 72.29 | 72.43 | | 35 day SMA | 72.65 | 72.72 | 72.8 | | 50 day SMA | 72.1 | 72.04 | 72 | | 100 day SMA | 67.38 | 67.29 | 67.24 | | 150 day SMA | 67.18 | 67.18 | 67.18 | | 200 day SMA | 67.05 | 67.03 | 67.02 |
|
|
