Sasol SSL full analysis,charts,indicators,moving averages,SMA,DMA,EMA,ADX,MACD,RSISasol SSL WideScreen charts, DMA,SMA,EMA technical analysis, forecast prediction, by indicators ADX,MACD,RSI,CCI USA stock exchange
operates under Energy sector & deals in Oil Gas Production
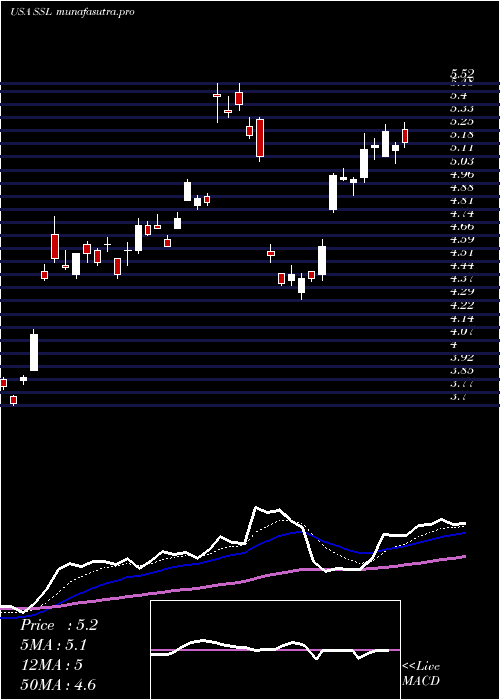
Daily price and charts and targets Sasol Strong Daily Stock price targets for Sasol SSL are 6.09 and 6.18 | Daily Target 1 | 6.07 | | Daily Target 2 | 6.1 | | Daily Target 3 | 6.1566666666667 | | Daily Target 4 | 6.19 | | Daily Target 5 | 6.25 |
Daily price and volume Sasol
| Date |
Closing |
Open |
Range |
Volume |
Thu 04 December 2025 |
6.14 (-4.06%) |
6.21 |
6.12 - 6.21 |
0.9655 times |
Wed 03 December 2025 |
6.40 (1.91%) |
6.40 |
6.35 - 6.46 |
0.978 times |
Tue 02 December 2025 |
6.28 (-3.09%) |
6.39 |
6.27 - 6.40 |
0.7037 times |
Mon 01 December 2025 |
6.48 (-0.31%) |
6.48 |
6.47 - 6.58 |
1.0879 times |
Fri 28 November 2025 |
6.50 (-0.31%) |
6.44 |
6.43 - 6.52 |
0.4385 times |
Wed 26 November 2025 |
6.52 (2.52%) |
6.43 |
6.41 - 6.54 |
0.86 times |
Tue 25 November 2025 |
6.36 (-3.05%) |
6.37 |
6.32 - 6.40 |
1.3684 times |
Mon 24 November 2025 |
6.56 (-3.53%) |
6.57 |
6.49 - 6.62 |
0.8509 times |
Fri 21 November 2025 |
6.80 (-0.29%) |
6.75 |
6.68 - 6.85 |
0.9712 times |
Thu 20 November 2025 |
6.82 (-6.58%) |
7.03 |
6.80 - 7.11 |
1.776 times |
Wed 19 November 2025 |
7.30 (-0.95%) |
7.30 |
7.25 - 7.36 |
0.9694 times |
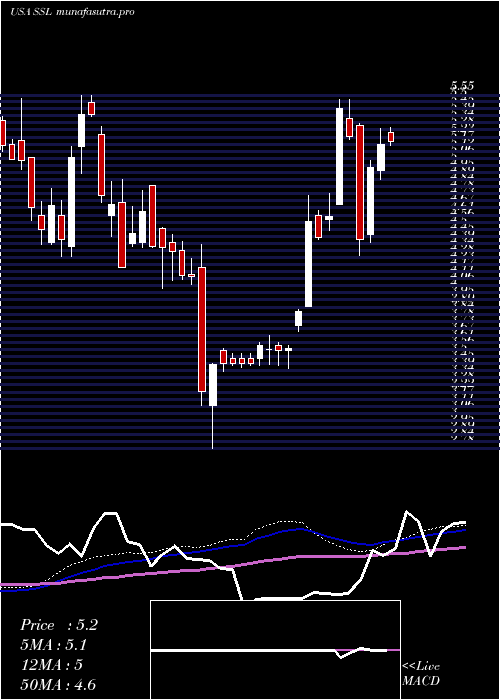
Weekly price and charts Sasol Strong weekly Stock price targets for Sasol SSL are 5.9 and 6.36 | Weekly Target 1 | 5.82 | | Weekly Target 2 | 5.98 | | Weekly Target 3 | 6.28 | | Weekly Target 4 | 6.44 | | Weekly Target 5 | 6.74 |
Weekly price and volumes for Sasol
| Date |
Closing |
Open |
Range |
Volume |
Thu 04 December 2025 |
6.14 (-5.54%) |
6.48 |
6.12 - 6.58 |
0.5691 times |
Fri 28 November 2025 |
6.50 (-4.41%) |
6.57 |
6.32 - 6.62 |
0.536 times |
Fri 21 November 2025 |
6.80 (-3.55%) |
7.25 |
6.68 - 7.39 |
1.0838 times |
Fri 14 November 2025 |
7.05 (4.75%) |
6.74 |
6.69 - 7.14 |
1.0666 times |
Fri 07 November 2025 |
6.73 (6.32%) |
6.15 |
6.13 - 6.78 |
1.4987 times |
Fri 31 October 2025 |
6.33 (0%) |
6.15 |
6.14 - 6.33 |
0.2064 times |
Fri 31 October 2025 |
6.33 (-3.51%) |
6.49 |
6.06 - 6.51 |
1.149 times |
Fri 24 October 2025 |
6.56 (19.71%) |
5.55 |
5.24 - 6.65 |
1.6856 times |
Fri 17 October 2025 |
5.48 (-2.66%) |
5.81 |
5.43 - 5.98 |
1.1091 times |
Fri 10 October 2025 |
5.63 (-9.92%) |
6.12 |
5.63 - 6.25 |
1.0957 times |
Fri 03 October 2025 |
6.25 (-0.48%) |
6.29 |
6.03 - 6.29 |
1.0063 times |
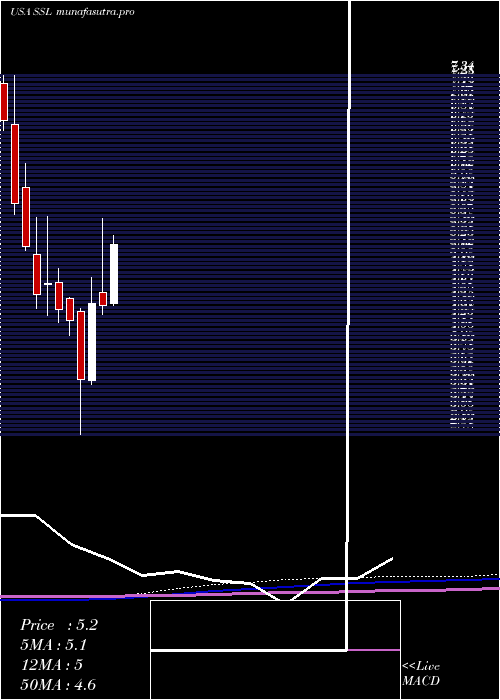
Monthly price and charts Sasol Strong monthly Stock price targets for Sasol SSL are 5.9 and 6.36 | Monthly Target 1 | 5.82 | | Monthly Target 2 | 5.98 | | Monthly Target 3 | 6.28 | | Monthly Target 4 | 6.44 | | Monthly Target 5 | 6.74 |
Monthly price and volumes Sasol
| Date |
Closing |
Open |
Range |
Volume |
Thu 04 December 2025 |
6.14 (-5.54%) |
6.48 |
6.12 - 6.58 |
0.1188 times |
Fri 28 November 2025 |
6.50 (2.69%) |
6.15 |
6.13 - 7.39 |
0.8734 times |
Fri 31 October 2025 |
6.33 (1.77%) |
6.19 |
5.24 - 6.65 |
1.2198 times |
Tue 30 September 2025 |
6.22 (-7.72%) |
6.89 |
6.11 - 7.25 |
1.1774 times |
Fri 29 August 2025 |
6.74 (31.64%) |
4.98 |
4.77 - 7.05 |
1.2619 times |
Thu 31 July 2025 |
5.12 (15.84%) |
4.44 |
4.41 - 5.50 |
1.1628 times |
Mon 30 June 2025 |
4.42 (-0.45%) |
4.58 |
4.30 - 5.52 |
1.1466 times |
Fri 30 May 2025 |
4.44 (27.59%) |
3.46 |
3.41 - 4.77 |
0.9511 times |
Wed 30 April 2025 |
3.48 (-17.73%) |
4.34 |
2.78 - 4.38 |
1.3883 times |
Mon 31 March 2025 |
4.23 (-3.2%) |
4.51 |
4.04 - 4.52 |
0.6999 times |
Fri 28 February 2025 |
4.37 (-7.02%) |
4.71 |
4.20 - 4.89 |
0.857 times |
DMA SMA EMA moving averages of Sasol SSL
DMA (daily moving average) of Sasol SSL
| DMA period | DMA value | | 5 day DMA | 6.36 | | 12 day DMA | 6.63 | | 20 day DMA | 6.72 | | 35 day DMA | 6.44 | | 50 day DMA | 6.32 | | 100 day DMA | 6.17 | | 150 day DMA | 5.61 | | 200 day DMA | 5.19 | EMA (exponential moving average) of Sasol SSL
| EMA period | EMA current | EMA prev | EMA prev2 | | 5 day EMA | 6.34 | 6.44 | 6.46 | | 12 day EMA | 6.5 | 6.57 | 6.6 | | 20 day EMA | 6.53 | 6.57 | 6.59 | | 35 day EMA | 6.48 | 6.5 | 6.51 | | 50 day EMA | 6.34 | 6.35 | 6.35 |
SMA (simple moving average) of Sasol SSL
| SMA period | SMA current | SMA prev | SMA prev2 | | 5 day SMA | 6.36 | 6.44 | 6.43 | | 12 day SMA | 6.63 | 6.71 | 6.77 | | 20 day SMA | 6.72 | 6.73 | 6.72 | | 35 day SMA | 6.44 | 6.43 | 6.42 | | 50 day SMA | 6.32 | 6.33 | 6.32 | | 100 day SMA | 6.17 | 6.16 | 6.14 | | 150 day SMA | 5.61 | 5.6 | 5.58 | | 200 day SMA | 5.19 | 5.19 | 5.18 |
|
|
