SouthState SSB full analysis,charts,indicators,moving averages,SMA,DMA,EMA,ADX,MACD,RSISouth State SSB WideScreen charts, DMA,SMA,EMA technical analysis, forecast prediction, by indicators ADX,MACD,RSI,CCI USA stock exchange
operates under Finance sector & deals in Major Banks
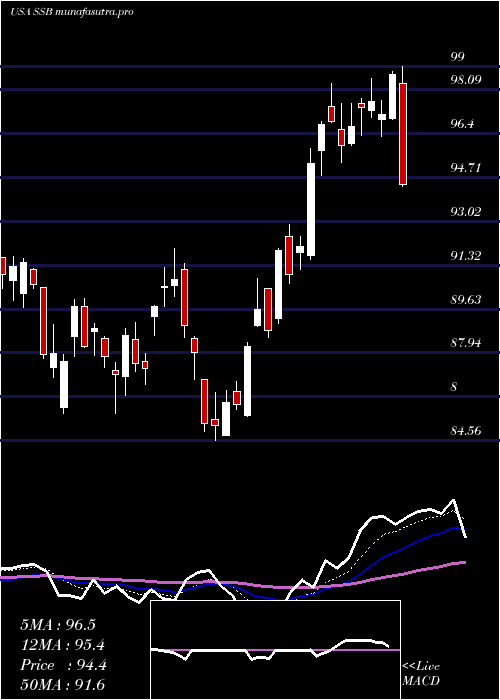
Daily price and charts and targets SouthState Strong Daily Stock price targets for SouthState SSB are 93.5 and 96.11 | Daily Target 1 | 91.42 | | Daily Target 2 | 92.97 | | Daily Target 3 | 94.033333333333 | | Daily Target 4 | 95.58 | | Daily Target 5 | 96.64 |
Daily price and volume South State
| Date |
Closing |
Open |
Range |
Volume |
Mon 20 October 2025 |
94.51 (2.21%) |
93.42 |
92.49 - 95.10 |
1.0947 times |
Fri 17 October 2025 |
92.47 (1.16%) |
92.81 |
91.50 - 93.18 |
1.1747 times |
Thu 16 October 2025 |
91.41 (-5.67%) |
96.25 |
90.19 - 96.77 |
1.7238 times |
Wed 15 October 2025 |
96.90 (-2.06%) |
99.30 |
96.50 - 99.84 |
0.8855 times |
Tue 14 October 2025 |
98.94 (2.85%) |
95.86 |
95.86 - 99.35 |
0.6246 times |
Mon 13 October 2025 |
96.20 (2.47%) |
95.04 |
94.64 - 96.70 |
0.9354 times |
Fri 10 October 2025 |
93.88 (-5.03%) |
99.66 |
93.81 - 99.88 |
1.2405 times |
Thu 09 October 2025 |
98.85 (-0.7%) |
100.14 |
98.48 - 100.47 |
0.766 times |
Wed 08 October 2025 |
99.55 (-0.46%) |
100.65 |
99.44 - 100.88 |
0.5451 times |
Tue 07 October 2025 |
100.01 (-0.74%) |
101.07 |
99.28 - 102.11 |
1.0095 times |
Mon 06 October 2025 |
100.76 (1.4%) |
100.15 |
99.61 - 102.18 |
1.0946 times |
Weekly price and charts SouthState Strong weekly Stock price targets for SouthState SSB are 93.5 and 96.11 | Weekly Target 1 | 91.42 | | Weekly Target 2 | 92.97 | | Weekly Target 3 | 94.033333333333 | | Weekly Target 4 | 95.58 | | Weekly Target 5 | 96.64 |
Weekly price and volumes for South State
| Date |
Closing |
Open |
Range |
Volume |
Mon 20 October 2025 |
94.51 (2.21%) |
93.42 |
92.49 - 95.10 |
0.2488 times |
Fri 17 October 2025 |
92.47 (-1.5%) |
95.04 |
90.19 - 99.84 |
1.2143 times |
Fri 10 October 2025 |
93.88 (-5.52%) |
100.15 |
93.81 - 102.18 |
1.0579 times |
Fri 03 October 2025 |
99.37 (-1.78%) |
101.68 |
97.00 - 101.83 |
1.1747 times |
Fri 26 September 2025 |
101.17 (-0.22%) |
100.76 |
99.18 - 102.17 |
0.8758 times |
Fri 19 September 2025 |
101.39 (0.14%) |
101.43 |
98.86 - 103.63 |
1.6029 times |
Fri 12 September 2025 |
101.25 (-1.71%) |
103.41 |
100.12 - 103.48 |
1.0721 times |
Fri 05 September 2025 |
103.01 (0.93%) |
100.78 |
100.22 - 105.00 |
1.4033 times |
Fri 29 August 2025 |
102.06 (0%) |
101.87 |
101.43 - 102.59 |
0.1974 times |
Fri 29 August 2025 |
102.06 (1.63%) |
100.17 |
98.79 - 102.61 |
1.1529 times |
Fri 22 August 2025 |
100.42 (5.26%) |
95.33 |
95.00 - 100.93 |
0.9955 times |
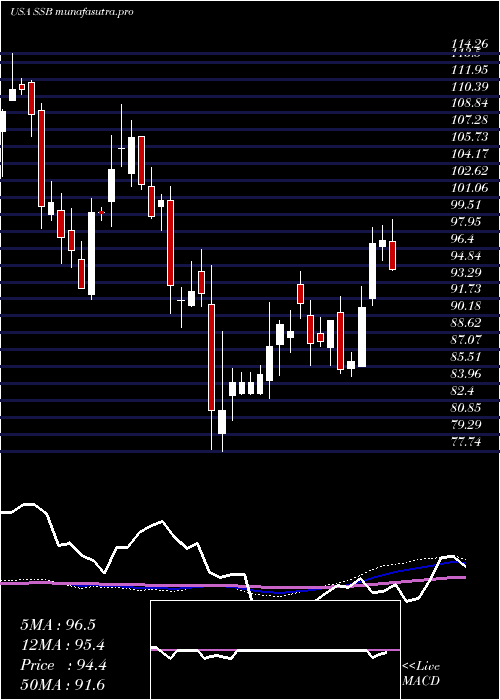
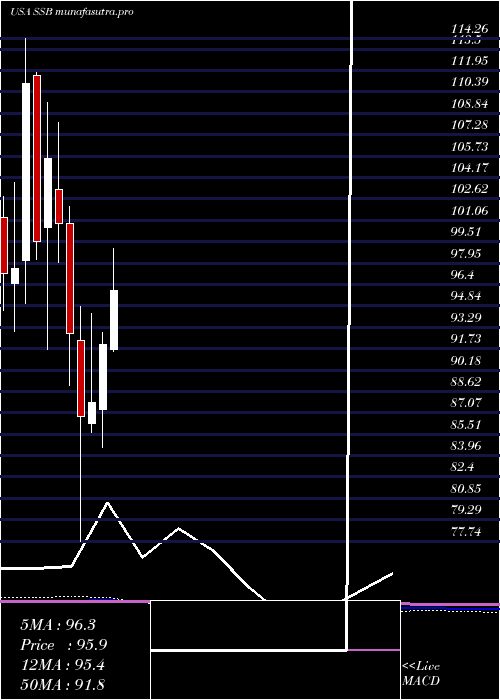
Monthly price and charts SouthState Strong monthly Stock price targets for SouthState SSB are 86.36 and 98.35 | Monthly Target 1 | 83.64 | | Monthly Target 2 | 89.07 | | Monthly Target 3 | 95.626666666667 | | Monthly Target 4 | 101.06 | | Monthly Target 5 | 107.62 |
Monthly price and volumes South State
| Date |
Closing |
Open |
Range |
Volume |
Mon 20 October 2025 |
94.51 (-4.41%) |
98.34 |
90.19 - 102.18 |
0.5173 times |
Tue 30 September 2025 |
98.87 (-3.13%) |
100.78 |
97.70 - 105.00 |
0.9025 times |
Fri 29 August 2025 |
102.06 (8.38%) |
93.09 |
90.41 - 102.61 |
0.85 times |
Thu 31 July 2025 |
94.17 (2.33%) |
91.70 |
91.54 - 101.55 |
1.2381 times |
Mon 30 June 2025 |
92.03 (4.82%) |
87.28 |
84.56 - 92.88 |
1.7858 times |
Fri 30 May 2025 |
87.80 (1.18%) |
86.27 |
85.62 - 94.26 |
0.9174 times |
Wed 30 April 2025 |
86.78 (-6.51%) |
92.32 |
77.74 - 94.79 |
1.0204 times |
Mon 31 March 2025 |
92.82 (-7.92%) |
100.82 |
89.08 - 102.05 |
0.8559 times |
Fri 28 February 2025 |
100.80 (-4.54%) |
103.31 |
98.00 - 108.18 |
0.554 times |
Fri 31 January 2025 |
105.59 (6.14%) |
100.50 |
91.68 - 109.64 |
1.3585 times |
Tue 31 December 2024 |
99.48 (-10.39%) |
111.62 |
98.22 - 111.83 |
0.5353 times |
DMA SMA EMA moving averages of South State SSB
DMA (daily moving average) of South State SSB
| DMA period | DMA value | | 5 day DMA | 94.85 | | 12 day DMA | 96.9 | | 20 day DMA | 97.96 | | 35 day DMA | 99.58 | | 50 day DMA | 99.28 | | 100 day DMA | 95.99 | | 150 day DMA | 93.43 | | 200 day DMA | 94.96 | EMA (exponential moving average) of South State SSB
| EMA period | EMA current | EMA prev | EMA prev2 | | 5 day EMA | 94.47 | 94.45 | 95.44 | | 12 day EMA | 96.16 | 96.46 | 97.18 | | 20 day EMA | 97.24 | 97.53 | 98.06 | | 35 day EMA | 97.83 | 98.03 | 98.36 | | 50 day EMA | 98.29 | 98.44 | 98.68 |
SMA (simple moving average) of South State SSB
| SMA period | SMA current | SMA prev | SMA prev2 | | 5 day SMA | 94.85 | 95.18 | 95.47 | | 12 day SMA | 96.9 | 97.19 | 97.69 | | 20 day SMA | 97.96 | 98.24 | 98.69 | | 35 day SMA | 99.58 | 99.79 | 100.07 | | 50 day SMA | 99.28 | 99.23 | 99.23 | | 100 day SMA | 95.99 | 95.94 | 95.9 | | 150 day SMA | 93.43 | 93.41 | 93.39 | | 200 day SMA | 94.96 | 94.97 | 95.01 |
|
|
