StoneridgeInc SRI full analysis,charts,indicators,moving averages,SMA,DMA,EMA,ADX,MACD,RSIStoneridge Inc SRI WideScreen charts, DMA,SMA,EMA technical analysis, forecast prediction, by indicators ADX,MACD,RSI,CCI USA stock exchange
operates under Capital Goods sector & deals in Auto Parts O E M
Daily price and charts and targets StoneridgeInc Strong Daily Stock price targets for StoneridgeInc SRI are 5.72 and 5.89 | Daily Target 1 | 5.58 | | Daily Target 2 | 5.68 | | Daily Target 3 | 5.7533333333333 | | Daily Target 4 | 5.85 | | Daily Target 5 | 5.92 |
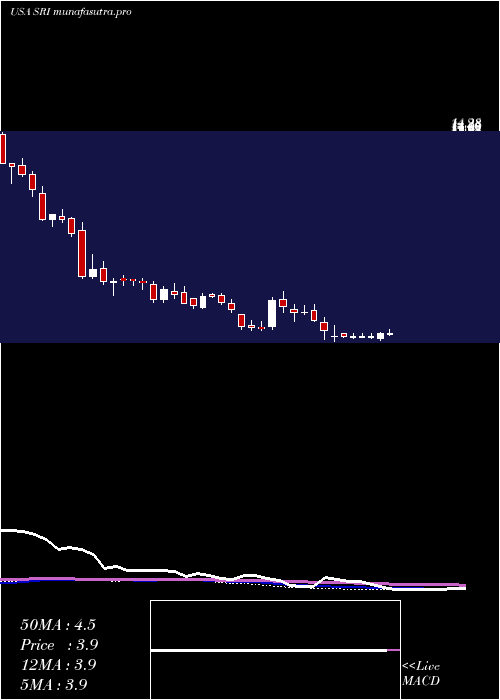
Daily price and volume Stoneridge Inc
| Date |
Closing |
Open |
Range |
Volume |
Thu 04 December 2025 |
5.77 (0.35%) |
5.74 |
5.66 - 5.83 |
0.8696 times |
Wed 03 December 2025 |
5.75 (-0.69%) |
5.75 |
5.61 - 5.82 |
1.0607 times |
Tue 02 December 2025 |
5.79 (4.32%) |
5.64 |
5.61 - 5.81 |
0.5248 times |
Mon 01 December 2025 |
5.55 (-2.8%) |
5.63 |
5.54 - 5.71 |
1.5126 times |
Fri 28 November 2025 |
5.71 (-0.35%) |
5.79 |
5.70 - 5.85 |
0.3137 times |
Wed 26 November 2025 |
5.73 (1.06%) |
5.66 |
5.66 - 5.84 |
1.0993 times |
Tue 25 November 2025 |
5.67 (3.47%) |
5.56 |
5.56 - 5.74 |
1.1878 times |
Mon 24 November 2025 |
5.48 (-1.26%) |
5.60 |
5.48 - 5.63 |
1.5163 times |
Fri 21 November 2025 |
5.55 (1.28%) |
5.52 |
5.45 - 5.62 |
0.695 times |
Thu 20 November 2025 |
5.48 (-1.44%) |
5.69 |
5.34 - 5.75 |
1.2205 times |
Wed 19 November 2025 |
5.56 (0.91%) |
5.49 |
5.47 - 5.70 |
1.0733 times |
Weekly price and charts StoneridgeInc Strong weekly Stock price targets for StoneridgeInc SRI are 5.66 and 5.95 | Weekly Target 1 | 5.42 | | Weekly Target 2 | 5.6 | | Weekly Target 3 | 5.7133333333333 | | Weekly Target 4 | 5.89 | | Weekly Target 5 | 6 |
Weekly price and volumes for Stoneridge Inc
| Date |
Closing |
Open |
Range |
Volume |
Thu 04 December 2025 |
5.77 (1.05%) |
5.63 |
5.54 - 5.83 |
0.7601 times |
Fri 28 November 2025 |
5.71 (2.88%) |
5.60 |
5.48 - 5.85 |
0.7888 times |
Fri 21 November 2025 |
5.55 (-2.97%) |
5.68 |
5.34 - 5.82 |
1.1624 times |
Fri 14 November 2025 |
5.72 (-7.29%) |
6.26 |
5.66 - 6.26 |
1.2395 times |
Fri 07 November 2025 |
6.17 (-9.4%) |
6.79 |
5.68 - 7.06 |
1.2429 times |
Fri 31 October 2025 |
6.81 (0%) |
6.75 |
6.55 - 6.83 |
0.4765 times |
Fri 31 October 2025 |
6.81 (-7.85%) |
7.39 |
6.55 - 7.41 |
1.442 times |
Fri 24 October 2025 |
7.39 (12.14%) |
6.62 |
6.62 - 7.53 |
1.1771 times |
Fri 17 October 2025 |
6.59 (-2.95%) |
6.53 |
6.43 - 7.05 |
1.3416 times |
Tue 07 October 2025 |
6.79 (-10.66%) |
7.66 |
6.76 - 7.66 |
0.3693 times |
Fri 03 October 2025 |
7.60 (0.93%) |
7.62 |
7.38 - 7.72 |
1.201 times |
Monthly price and charts StoneridgeInc Strong monthly Stock price targets for StoneridgeInc SRI are 5.66 and 5.95 | Monthly Target 1 | 5.42 | | Monthly Target 2 | 5.6 | | Monthly Target 3 | 5.7133333333333 | | Monthly Target 4 | 5.89 | | Monthly Target 5 | 6 |
Monthly price and volumes Stoneridge Inc
| Date |
Closing |
Open |
Range |
Volume |
Thu 04 December 2025 |
5.77 (1.05%) |
5.63 |
5.54 - 5.83 |
0.0985 times |
Fri 28 November 2025 |
5.71 (-16.15%) |
6.79 |
5.34 - 7.06 |
0.5742 times |
Fri 31 October 2025 |
6.81 (-10.63%) |
7.48 |
6.43 - 7.72 |
0.7246 times |
Tue 30 September 2025 |
7.62 (-8.19%) |
8.01 |
7.38 - 8.60 |
0.7332 times |
Fri 29 August 2025 |
8.30 (7.79%) |
7.45 |
6.91 - 8.74 |
0.9769 times |
Thu 31 July 2025 |
7.70 (9.38%) |
6.88 |
6.68 - 9.10 |
1.6617 times |
Mon 30 June 2025 |
7.04 (40.24%) |
4.98 |
4.91 - 7.05 |
1.6398 times |
Fri 30 May 2025 |
5.02 (30.05%) |
4.34 |
4.12 - 5.49 |
1.4163 times |
Wed 30 April 2025 |
3.86 (-15.9%) |
4.59 |
3.54 - 4.79 |
0.8561 times |
Mon 31 March 2025 |
4.59 (-18.33%) |
5.68 |
4.43 - 6.12 |
1.3187 times |
Fri 28 February 2025 |
5.62 (8.7%) |
4.90 |
4.11 - 5.79 |
1.7186 times |

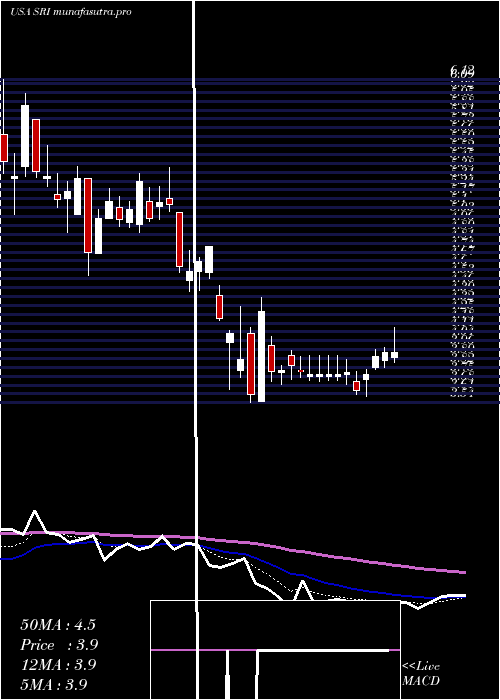
DMA SMA EMA moving averages of Stoneridge Inc SRI
DMA (daily moving average) of Stoneridge Inc SRI
| DMA period | DMA value | | 5 day DMA | 5.71 | | 12 day DMA | 5.63 | | 20 day DMA | 5.73 | | 35 day DMA | 6.28 | | 50 day DMA | 6.63 | | 100 day DMA | 7.29 | | 150 day DMA | 6.74 | | 200 day DMA | 6.18 | EMA (exponential moving average) of Stoneridge Inc SRI
| EMA period | EMA current | EMA prev | EMA prev2 | | 5 day EMA | 5.72 | 5.7 | 5.68 | | 12 day EMA | 5.74 | 5.73 | 5.73 | | 20 day EMA | 5.89 | 5.9 | 5.92 | | 35 day EMA | 6.23 | 6.26 | 6.29 | | 50 day EMA | 6.67 | 6.71 | 6.75 |
SMA (simple moving average) of Stoneridge Inc SRI
| SMA period | SMA current | SMA prev | SMA prev2 | | 5 day SMA | 5.71 | 5.71 | 5.69 | | 12 day SMA | 5.63 | 5.61 | 5.61 | | 20 day SMA | 5.73 | 5.79 | 5.84 | | 35 day SMA | 6.28 | 6.31 | 6.34 | | 50 day SMA | 6.63 | 6.69 | 6.74 | | 100 day SMA | 7.29 | 7.31 | 7.34 | | 150 day SMA | 6.74 | 6.72 | 6.71 | | 200 day SMA | 6.18 | 6.18 | 6.17 |
|
|
