SpireInc SR full analysis,charts,indicators,moving averages,SMA,DMA,EMA,ADX,MACD,RSISpire Inc SR WideScreen charts, DMA,SMA,EMA technical analysis, forecast prediction, by indicators ADX,MACD,RSI,CCI USA stock exchange
operates under Public Utilities sector & deals in Oil Gas Transmission
Daily price and charts and targets SpireInc Strong Daily Stock price targets for SpireInc SR are 81.45 and 83.12 | Daily Target 1 | 81.14 | | Daily Target 2 | 81.75 | | Daily Target 3 | 82.806666666667 | | Daily Target 4 | 83.42 | | Daily Target 5 | 84.48 |
Daily price and volume Spire Inc
| Date |
Closing |
Open |
Range |
Volume |
Thu 04 December 2025 |
82.37 (-1.75%) |
83.26 |
82.19 - 83.86 |
1.3605 times |
Wed 03 December 2025 |
83.84 (-1.1%) |
85.45 |
83.64 - 85.77 |
1.1873 times |
Tue 02 December 2025 |
84.77 (-2.33%) |
86.84 |
84.75 - 87.14 |
0.7317 times |
Mon 01 December 2025 |
86.79 (-2.11%) |
88.34 |
86.30 - 88.63 |
0.8684 times |
Fri 28 November 2025 |
88.66 (0.57%) |
88.66 |
88.05 - 88.66 |
0.3423 times |
Wed 26 November 2025 |
88.16 (1.23%) |
87.15 |
86.57 - 88.26 |
0.7454 times |
Tue 25 November 2025 |
87.09 (0.44%) |
86.05 |
86.05 - 87.67 |
1.2822 times |
Mon 24 November 2025 |
86.71 (0.71%) |
86.75 |
84.78 - 87.17 |
1.4384 times |
Fri 21 November 2025 |
86.10 (0.83%) |
86.14 |
85.15 - 87.06 |
1.0704 times |
Thu 20 November 2025 |
85.39 (0.27%) |
85.78 |
85.36 - 87.12 |
0.9733 times |
Wed 19 November 2025 |
85.16 (-1.16%) |
85.85 |
85.13 - 86.73 |
0.927 times |
Weekly price and charts SpireInc Strong weekly Stock price targets for SpireInc SR are 79.06 and 85.5 | Weekly Target 1 | 77.96 | | Weekly Target 2 | 80.16 | | Weekly Target 3 | 84.396666666667 | | Weekly Target 4 | 86.6 | | Weekly Target 5 | 90.84 |
Weekly price and volumes for Spire Inc
| Date |
Closing |
Open |
Range |
Volume |
Thu 04 December 2025 |
82.37 (-7.09%) |
88.34 |
82.19 - 88.63 |
0.811 times |
Fri 28 November 2025 |
88.66 (2.97%) |
86.75 |
84.78 - 88.66 |
0.7446 times |
Fri 21 November 2025 |
86.10 (-1.03%) |
87.59 |
84.71 - 87.75 |
1.2248 times |
Fri 14 November 2025 |
87.00 (-2.99%) |
89.73 |
85.76 - 91.11 |
1.5555 times |
Fri 07 November 2025 |
89.68 (3.8%) |
87.86 |
86.55 - 89.97 |
0.8787 times |
Fri 31 October 2025 |
86.40 (0%) |
86.77 |
85.68 - 87.27 |
0.3533 times |
Fri 31 October 2025 |
86.40 (-2.81%) |
88.58 |
85.68 - 89.07 |
1.1895 times |
Fri 24 October 2025 |
88.90 (4.16%) |
85.79 |
85.68 - 89.09 |
1.2965 times |
Fri 17 October 2025 |
85.35 (3.69%) |
83.19 |
82.46 - 86.31 |
0.9361 times |
Fri 10 October 2025 |
82.31 (0.02%) |
82.62 |
81.28 - 83.95 |
1.0101 times |
Fri 03 October 2025 |
82.29 (2.22%) |
80.46 |
79.85 - 83.10 |
1.0101 times |
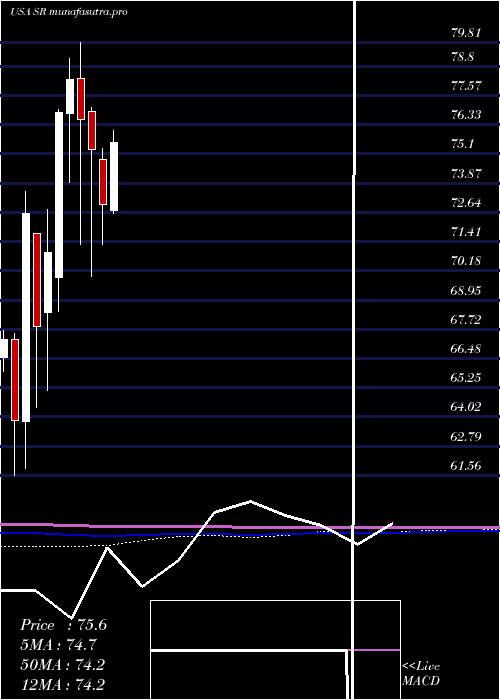
Monthly price and charts SpireInc Strong monthly Stock price targets for SpireInc SR are 79.06 and 85.5 | Monthly Target 1 | 77.96 | | Monthly Target 2 | 80.16 | | Monthly Target 3 | 84.396666666667 | | Monthly Target 4 | 86.6 | | Monthly Target 5 | 90.84 |
Monthly price and volumes Spire Inc
| Date |
Closing |
Open |
Range |
Volume |
Thu 04 December 2025 |
82.37 (-7.09%) |
88.34 |
82.19 - 88.63 |
0.1691 times |
Fri 28 November 2025 |
88.66 (2.62%) |
87.86 |
84.71 - 91.11 |
0.9182 times |
Fri 31 October 2025 |
86.40 (5.99%) |
81.27 |
80.68 - 89.09 |
1.0954 times |
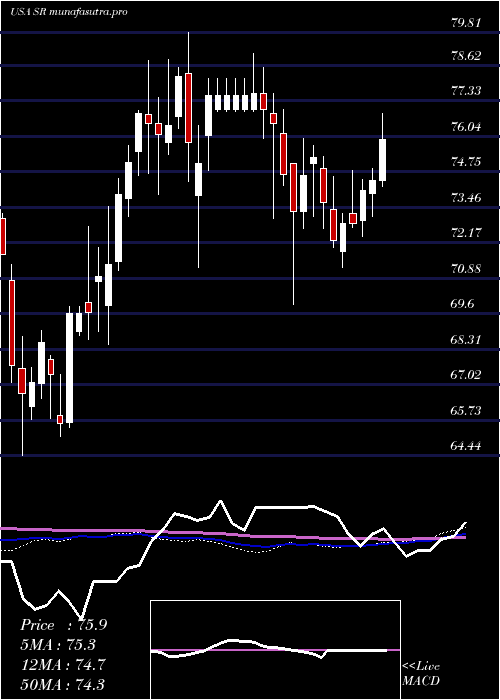
Tue 30 September 2025 |
81.52 (6.42%) |
75.97 |
73.91 - 82.14 |
1.2302 times |
Fri 29 August 2025 |
76.60 (2.86%) |
73.48 |
73.48 - 78.05 |
1.0671 times |
Thu 31 July 2025 |
74.47 (2.03%) |
72.72 |
71.24 - 77.92 |
1.3181 times |
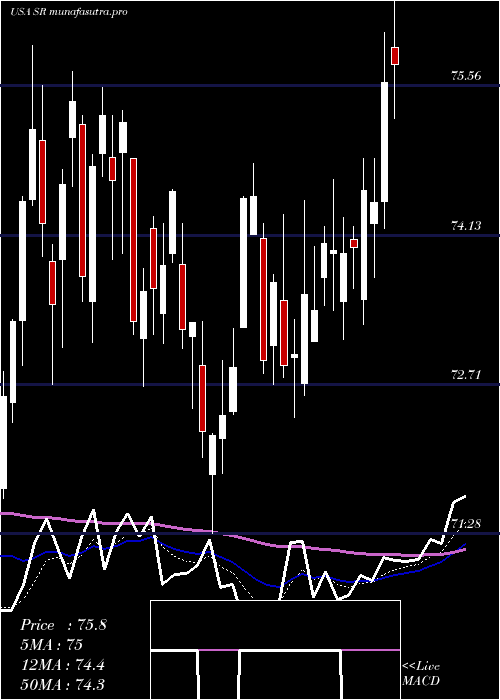
Mon 30 June 2025 |
72.99 (-3.04%) |
74.87 |
71.28 - 75.32 |
1.0102 times |
Fri 30 May 2025 |
75.28 (-1.65%) |
76.91 |
69.94 - 77.07 |
0.9591 times |
Wed 30 April 2025 |
76.54 (-2.19%) |
78.28 |
71.28 - 79.81 |
1.1364 times |
Mon 31 March 2025 |
78.25 (1.81%) |
76.82 |
73.91 - 79.11 |
1.0962 times |
Fri 28 February 2025 |
76.86 (8.31%) |
69.91 |
68.48 - 76.96 |
0.8939 times |
DMA SMA EMA moving averages of Spire Inc SR
DMA (daily moving average) of Spire Inc SR
| DMA period | DMA value | | 5 day DMA | 85.29 | | 12 day DMA | 85.93 | | 20 day DMA | 87.07 | | 35 day DMA | 87.14 | | 50 day DMA | 85.67 | | 100 day DMA | 80.87 | | 150 day DMA | 78.6 | | 200 day DMA | 78.11 | EMA (exponential moving average) of Spire Inc SR
| EMA period | EMA current | EMA prev | EMA prev2 | | 5 day EMA | 84.52 | 85.6 | 86.48 | | 12 day EMA | 85.77 | 86.39 | 86.85 | | 20 day EMA | 86.18 | 86.58 | 86.87 | | 35 day EMA | 85.65 | 85.84 | 85.96 | | 50 day EMA | 84.94 | 85.04 | 85.09 |
SMA (simple moving average) of Spire Inc SR
| SMA period | SMA current | SMA prev | SMA prev2 | | 5 day SMA | 85.29 | 86.44 | 87.09 | | 12 day SMA | 85.93 | 86.14 | 86.4 | | 20 day SMA | 87.07 | 87.32 | 87.55 | | 35 day SMA | 87.14 | 87.23 | 87.23 | | 50 day SMA | 85.67 | 85.6 | 85.49 | | 100 day SMA | 80.87 | 80.8 | 80.72 | | 150 day SMA | 78.6 | 78.56 | 78.51 | | 200 day SMA | 78.11 | 78.07 | 78.02 |
|
|
