SP SPGI full analysis,charts,indicators,moving averages,SMA,DMA,EMA,ADX,MACD,RSIS P SPGI WideScreen charts, DMA,SMA,EMA technical analysis, forecast prediction, by indicators ADX,MACD,RSI,CCI USA stock exchange
operates under Finance sector & deals in Finance Consumer Services
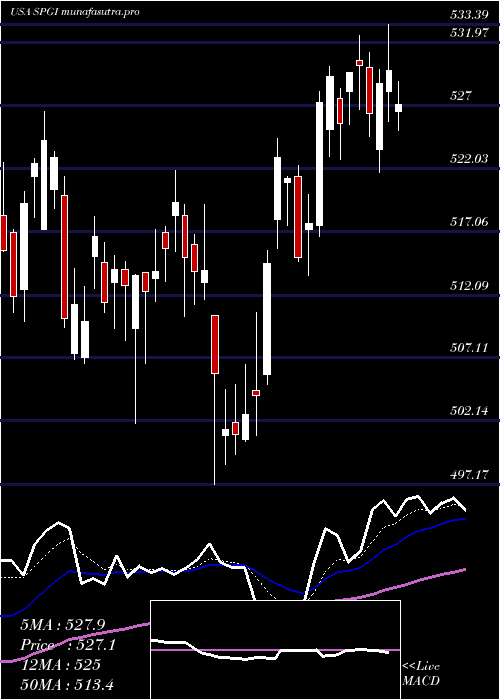
Daily price and charts and targets SP Strong Daily Stock price targets for SP SPGI are 492.05 and 499.55 | Daily Target 1 | 490.4 | | Daily Target 2 | 493.69 | | Daily Target 3 | 497.89666666667 | | Daily Target 4 | 501.19 | | Daily Target 5 | 505.4 |
Daily price and volume S P
| Date |
Closing |
Open |
Range |
Volume |
Thu 04 December 2025 |
496.99 (-0.58%) |
499.11 |
494.60 - 502.10 |
0.6809 times |
Wed 03 December 2025 |
499.88 (1.77%) |
492.26 |
491.79 - 501.74 |
0.9037 times |
Tue 02 December 2025 |
491.21 (-0.82%) |
494.91 |
490.81 - 496.55 |
0.8668 times |
Mon 01 December 2025 |
495.27 (-0.71%) |
495.51 |
494.78 - 500.43 |
1.0981 times |
Fri 28 November 2025 |
498.83 (0.65%) |
497.95 |
495.66 - 500.18 |
0.5456 times |
Wed 26 November 2025 |
495.61 (0.29%) |
491.66 |
490.00 - 498.46 |
0.7584 times |
Tue 25 November 2025 |
494.19 (1.01%) |
490.32 |
489.24 - 496.54 |
0.8273 times |
Mon 24 November 2025 |
489.24 (-0.88%) |
494.00 |
488.82 - 494.23 |
2.0253 times |
Fri 21 November 2025 |
493.60 (0.55%) |
494.07 |
490.35 - 497.00 |
1.3868 times |
Thu 20 November 2025 |
490.91 (0.02%) |
493.80 |
488.95 - 498.32 |
0.9071 times |
Wed 19 November 2025 |
490.80 (0.11%) |
490.75 |
487.92 - 493.00 |
1.1165 times |
Weekly price and charts SP Strong weekly Stock price targets for SP SPGI are 493.9 and 505.19 | Weekly Target 1 | 485.34 | | Weekly Target 2 | 491.17 | | Weekly Target 3 | 496.63333333333 | | Weekly Target 4 | 502.46 | | Weekly Target 5 | 507.92 |
Weekly price and volumes for S P
| Date |
Closing |
Open |
Range |
Volume |
Thu 04 December 2025 |
496.99 (-0.37%) |
495.51 |
490.81 - 502.10 |
0.7848 times |
Fri 28 November 2025 |
498.83 (1.06%) |
494.00 |
488.82 - 500.18 |
0.919 times |
Fri 21 November 2025 |
493.60 (-0.06%) |
492.50 |
486.25 - 498.32 |
1.2511 times |
Fri 14 November 2025 |
493.90 (-0.51%) |
493.59 |
487.58 - 506.27 |
1.231 times |
Fri 07 November 2025 |
496.42 (1.89%) |
491.56 |
483.99 - 500.37 |
0.9465 times |
Fri 31 October 2025 |
487.21 (0%) |
493.96 |
485.57 - 498.00 |
0.406 times |
Fri 31 October 2025 |
487.21 (-0.46%) |
492.04 |
470.97 - 500.25 |
1.7519 times |
Fri 24 October 2025 |
489.45 (3.44%) |
475.00 |
472.84 - 492.23 |
0.942 times |
Fri 17 October 2025 |
473.19 (-1.67%) |
485.92 |
470.00 - 491.32 |
1.3245 times |
Tue 07 October 2025 |
481.22 (0.29%) |
483.00 |
474.28 - 485.10 |
0.4432 times |
Fri 03 October 2025 |
479.81 (-1.51%) |
491.96 |
474.77 - 493.97 |
1.2139 times |
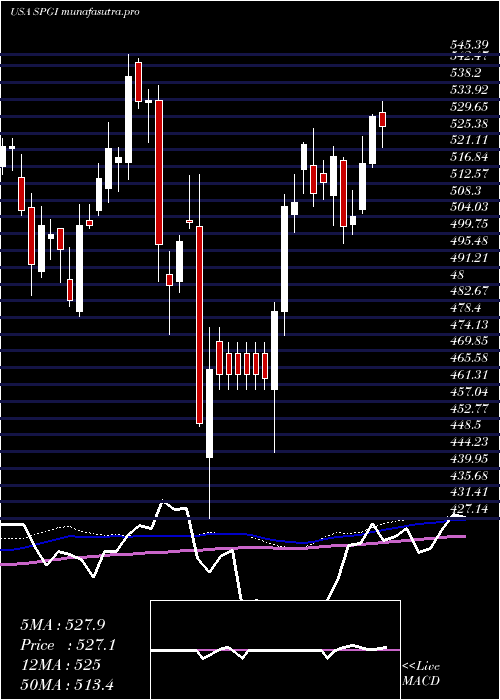
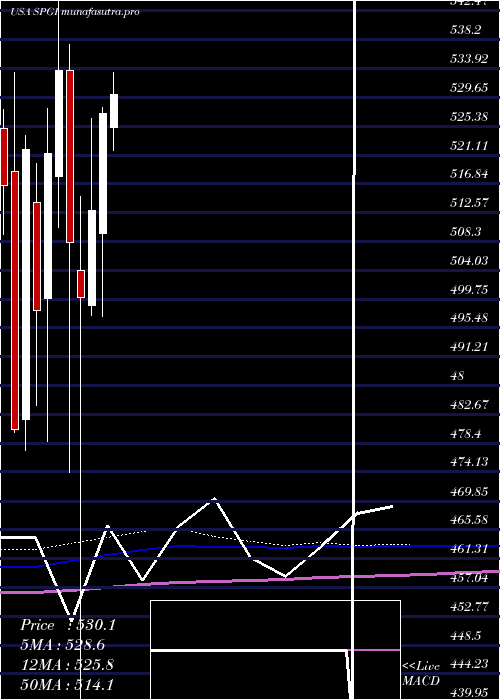
Monthly price and charts SP Strong monthly Stock price targets for SP SPGI are 493.9 and 505.19 | Monthly Target 1 | 485.34 | | Monthly Target 2 | 491.17 | | Monthly Target 3 | 496.63333333333 | | Monthly Target 4 | 502.46 | | Monthly Target 5 | 507.92 |
Monthly price and volumes S P
| Date |
Closing |
Open |
Range |
Volume |
Thu 04 December 2025 |
496.99 (-0.37%) |
495.51 |
490.81 - 502.10 |
0.1947 times |
Fri 28 November 2025 |
498.83 (2.39%) |
491.56 |
483.99 - 506.27 |
1.0785 times |
Fri 31 October 2025 |
487.21 (0.1%) |
488.90 |
470.00 - 500.25 |
1.3696 times |
Tue 30 September 2025 |
486.71 (-11.26%) |
543.63 |
482.37 - 552.17 |
1.3034 times |
Fri 29 August 2025 |
548.44 (-0.48%) |
545.01 |
540.32 - 579.05 |
0.948 times |
Thu 31 July 2025 |
551.10 (4.52%) |
525.17 |
514.61 - 558.86 |
0.8789 times |
Mon 30 June 2025 |
527.29 (2.81%) |
509.43 |
497.17 - 528.16 |
0.932 times |
Fri 30 May 2025 |
512.86 (2.56%) |
498.90 |
497.34 - 526.52 |
0.9323 times |
Wed 30 April 2025 |
500.05 (-1.58%) |
504.07 |
427.14 - 514.91 |
1.1732 times |
Mon 31 March 2025 |
508.10 (-4.8%) |
533.74 |
474.04 - 537.55 |
1.1895 times |
Fri 28 February 2025 |
533.74 (2.36%) |
517.91 |
510.40 - 545.39 |
1.0828 times |
DMA SMA EMA moving averages of S P SPGI
DMA (daily moving average) of S P SPGI
| DMA period | DMA value | | 5 day DMA | 496.44 | | 12 day DMA | 493.9 | | 20 day DMA | 494.32 | | 35 day DMA | 490.59 | | 50 day DMA | 489.21 | | 100 day DMA | 515.73 | | 150 day DMA | 515.01 | | 200 day DMA | 509.3 | EMA (exponential moving average) of S P SPGI
| EMA period | EMA current | EMA prev | EMA prev2 | | 5 day EMA | 496.25 | 495.88 | 493.88 | | 12 day EMA | 494.93 | 494.56 | 493.59 | | 20 day EMA | 494.1 | 493.8 | 493.16 | | 35 day EMA | 493.71 | 493.52 | 493.15 | | 50 day EMA | 493.18 | 493.02 | 492.74 |
SMA (simple moving average) of S P SPGI
| SMA period | SMA current | SMA prev | SMA prev2 | | 5 day SMA | 496.44 | 496.16 | 495.02 | | 12 day SMA | 493.9 | 493.23 | 492.73 | | 20 day SMA | 494.32 | 494.33 | 494.3 | | 35 day SMA | 490.59 | 490.19 | 489.81 | | 50 day SMA | 489.21 | 489.41 | 489.57 | | 100 day SMA | 515.73 | 516.05 | 516.34 | | 150 day SMA | 515.01 | 514.9 | 514.77 | | 200 day SMA | 509.3 | 509.51 | 509.73 |
|
|
