Supercom SPCB full analysis,charts,indicators,moving averages,SMA,DMA,EMA,ADX,MACD,RSISupercom SPCB WideScreen charts, DMA,SMA,EMA technical analysis, forecast prediction, by indicators ADX,MACD,RSI,CCI USA stock exchange
operates under Technology sector & deals in Semiconductors
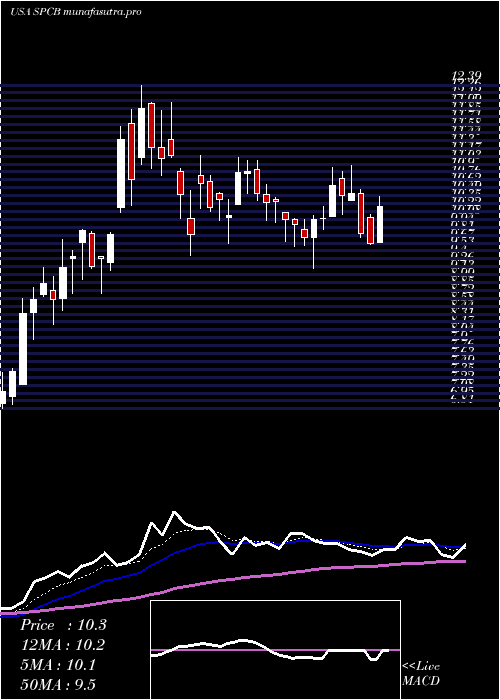
Daily price and charts and targets Supercom Strong Daily Stock price targets for Supercom SPCB are 10.43 and 10.85 | Daily Target 1 | 10.09 | | Daily Target 2 | 10.35 | | Daily Target 3 | 10.506666666667 | | Daily Target 4 | 10.77 | | Daily Target 5 | 10.93 |
Daily price and volume Supercom
| Date |
Closing |
Open |
Range |
Volume |
Tue 21 October 2025 |
10.62 (0.47%) |
10.50 |
10.24 - 10.66 |
0.7605 times |
Mon 20 October 2025 |
10.57 (3.22%) |
10.40 |
10.32 - 10.61 |
0.5582 times |
Fri 17 October 2025 |
10.24 (-3.21%) |
10.60 |
10.00 - 10.60 |
0.893 times |
Thu 16 October 2025 |
10.58 (2.92%) |
10.55 |
10.43 - 11.28 |
1.657 times |
Wed 15 October 2025 |
10.28 (-2.37%) |
10.41 |
10.07 - 10.77 |
0.8847 times |
Tue 14 October 2025 |
10.53 (-3.39%) |
10.51 |
9.71 - 10.95 |
1.5044 times |
Mon 13 October 2025 |
10.90 (5.72%) |
10.60 |
10.48 - 10.90 |
0.408 times |
Fri 10 October 2025 |
10.31 (-7.78%) |
11.00 |
10.29 - 11.17 |
1.1224 times |
Thu 09 October 2025 |
11.18 (4.58%) |
10.75 |
10.53 - 11.30 |
1.2289 times |
Wed 08 October 2025 |
10.69 (-3.61%) |
11.22 |
10.56 - 11.27 |
0.9829 times |
Tue 07 October 2025 |
11.09 (2.97%) |
10.78 |
10.65 - 11.23 |
0.9048 times |
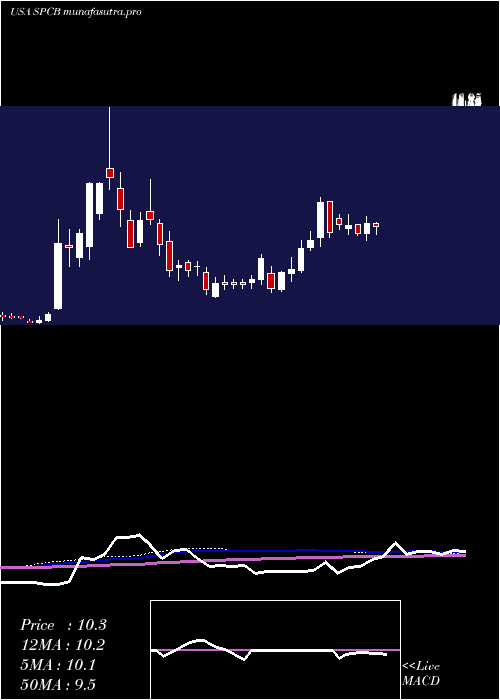
Weekly price and charts Supercom Strong weekly Stock price targets for Supercom SPCB are 10.43 and 10.85 | Weekly Target 1 | 10.09 | | Weekly Target 2 | 10.35 | | Weekly Target 3 | 10.506666666667 | | Weekly Target 4 | 10.77 | | Weekly Target 5 | 10.93 |
Weekly price and volumes for Supercom
| Date |
Closing |
Open |
Range |
Volume |
Tue 21 October 2025 |
10.62 (3.71%) |
10.40 |
10.24 - 10.66 |
0.2627 times |
Fri 17 October 2025 |
10.24 (-0.68%) |
10.60 |
9.71 - 11.28 |
1.0652 times |
Fri 10 October 2025 |
10.31 (-10.03%) |
11.24 |
10.29 - 11.38 |
1.1667 times |
Fri 03 October 2025 |
11.46 (-11.16%) |
13.06 |
11.34 - 13.16 |
1.108 times |
Fri 26 September 2025 |
12.90 (9.79%) |
11.93 |
11.89 - 13.57 |
1.964 times |
Fri 19 September 2025 |
11.75 (12.55%) |
10.45 |
9.91 - 12.19 |
1.306 times |
Fri 12 September 2025 |
10.44 (7.63%) |
9.77 |
9.40 - 10.72 |
1.2334 times |
Fri 05 September 2025 |
9.70 (8.74%) |
8.81 |
8.60 - 9.75 |
0.9116 times |
Fri 29 August 2025 |
8.92 (0%) |
9.02 |
8.85 - 9.18 |
0.1171 times |
Fri 29 August 2025 |
8.92 (-3.98%) |
9.25 |
8.81 - 9.38 |
0.8654 times |
Fri 22 August 2025 |
9.29 (-7.84%) |
9.84 |
8.91 - 10.02 |
1.6104 times |
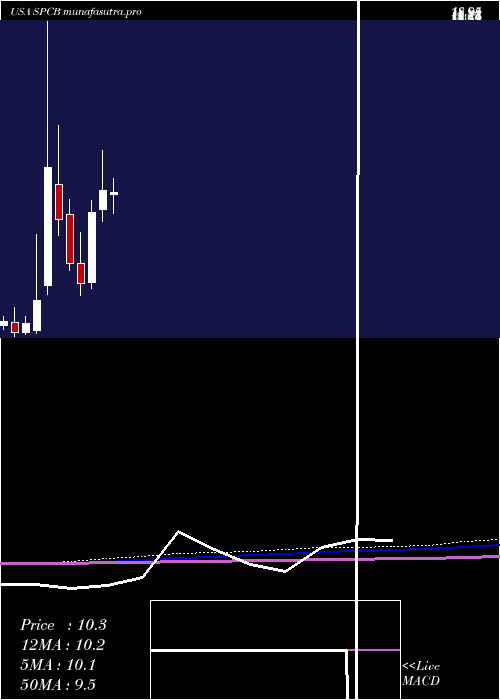
Monthly price and charts Supercom Strong monthly Stock price targets for Supercom SPCB are 9 and 11.34 | Monthly Target 1 | 8.45 | | Monthly Target 2 | 9.54 | | Monthly Target 3 | 10.793333333333 | | Monthly Target 4 | 11.88 | | Monthly Target 5 | 13.13 |
Monthly price and volumes Supercom
| Date |
Closing |
Open |
Range |
Volume |
Tue 21 October 2025 |
10.62 (-11.79%) |
11.80 |
9.71 - 12.05 |
0.1355 times |
Tue 30 September 2025 |
12.04 (34.98%) |
8.81 |
8.60 - 13.57 |
0.2508 times |
Fri 29 August 2025 |
8.92 (1.25%) |
8.62 |
8.41 - 12.25 |
0.3927 times |
Thu 31 July 2025 |
8.81 (-15.13%) |
10.20 |
8.45 - 11.00 |
0.2188 times |
Mon 30 June 2025 |
10.38 (12.1%) |
9.43 |
8.80 - 12.39 |
0.3606 times |
Fri 30 May 2025 |
9.26 (63.89%) |
5.70 |
5.43 - 9.90 |
0.5149 times |
Wed 30 April 2025 |
5.65 (-15.17%) |
6.70 |
5.06 - 8.25 |
0.667 times |
Mon 31 March 2025 |
6.66 (-25.42%) |
9.15 |
6.32 - 9.91 |
0.2238 times |
Fri 28 February 2025 |
8.93 (-22.62%) |
10.70 |
8.12 - 13.69 |
0.6613 times |
Fri 31 January 2025 |
11.54 (139.42%) |
5.55 |
5.11 - 18.95 |
6.5745 times |
Tue 31 December 2024 |
4.82 (32.78%) |
3.29 |
3.14 - 8.14 |
0.6845 times |
DMA SMA EMA moving averages of Supercom SPCB
DMA (daily moving average) of Supercom SPCB
| DMA period | DMA value | | 5 day DMA | 10.46 | | 12 day DMA | 10.65 | | 20 day DMA | 11.3 | | 35 day DMA | 11 | | 50 day DMA | 10.49 | | 100 day DMA | 10.34 | | 150 day DMA | 9.16 | | 200 day DMA | 9.39 | EMA (exponential moving average) of Supercom SPCB
| EMA period | EMA current | EMA prev | EMA prev2 | | 5 day EMA | 10.54 | 10.5 | 10.47 | | 12 day EMA | 10.74 | 10.76 | 10.79 | | 20 day EMA | 10.87 | 10.9 | 10.94 | | 35 day EMA | 10.74 | 10.75 | 10.76 | | 50 day EMA | 10.52 | 10.52 | 10.52 |
SMA (simple moving average) of Supercom SPCB
| SMA period | SMA current | SMA prev | SMA prev2 | | 5 day SMA | 10.46 | 10.44 | 10.51 | | 12 day SMA | 10.65 | 10.72 | 10.81 | | 20 day SMA | 11.3 | 11.39 | 11.5 | | 35 day SMA | 11 | 10.95 | 10.9 | | 50 day SMA | 10.49 | 10.5 | 10.52 | | 100 day SMA | 10.34 | 10.33 | 10.32 | | 150 day SMA | 9.16 | 9.14 | 9.12 | | 200 day SMA | 9.39 | 9.38 | 9.35 |
|
|
