Renesola SOL full analysis,charts,indicators,moving averages,SMA,DMA,EMA,ADX,MACD,RSIRenesola SOL WideScreen charts, DMA,SMA,EMA technical analysis, forecast prediction, by indicators ADX,MACD,RSI,CCI USA stock exchange
operates under Technology sector & deals in Semiconductors
Daily price and charts and targets Renesola Strong Daily Stock price targets for Renesola SOL are 1.84 and 1.88 | Daily Target 1 | 1.81 | | Daily Target 2 | 1.83 | | Daily Target 3 | 1.85 | | Daily Target 4 | 1.87 | | Daily Target 5 | 1.89 |
Daily price and volume Renesola
| Date |
Closing |
Open |
Range |
Volume |
Wed 22 October 2025 |
1.85 (-1.07%) |
1.83 |
1.83 - 1.87 |
0.631 times |
Tue 21 October 2025 |
1.87 (0.54%) |
1.86 |
1.85 - 1.87 |
0.386 times |
Mon 20 October 2025 |
1.86 (2.2%) |
1.82 |
1.82 - 1.86 |
1.0289 times |
Fri 17 October 2025 |
1.82 (-1.09%) |
1.83 |
1.81 - 1.84 |
0.969 times |
Thu 16 October 2025 |
1.84 (-0.54%) |
1.84 |
1.83 - 1.86 |
0.7168 times |
Wed 15 October 2025 |
1.85 (-0.54%) |
1.84 |
1.84 - 1.87 |
0.7117 times |
Tue 14 October 2025 |
1.86 (2.2%) |
1.83 |
1.82 - 1.86 |
1.1151 times |
Mon 13 October 2025 |
1.82 (-3.7%) |
1.85 |
1.82 - 1.86 |
1.2666 times |
Tue 07 October 2025 |
1.89 (-1.05%) |
1.91 |
1.88 - 1.92 |
0.8594 times |
Mon 06 October 2025 |
1.91 (3.24%) |
1.87 |
1.85 - 1.91 |
2.3156 times |
Fri 03 October 2025 |
1.85 (-1.07%) |
1.88 |
1.85 - 1.88 |
0.776 times |
Weekly price and charts Renesola Strong weekly Stock price targets for Renesola SOL are 1.84 and 1.89 | Weekly Target 1 | 1.8 | | Weekly Target 2 | 1.82 | | Weekly Target 3 | 1.8466666666667 | | Weekly Target 4 | 1.87 | | Weekly Target 5 | 1.9 |
Weekly price and volumes for Renesola
| Date |
Closing |
Open |
Range |
Volume |
Wed 22 October 2025 |
1.85 (1.65%) |
1.82 |
1.82 - 1.87 |
0.7401 times |
Fri 17 October 2025 |
1.82 (-3.7%) |
1.85 |
1.81 - 1.87 |
1.7288 times |
Tue 07 October 2025 |
1.89 (2.16%) |
1.87 |
1.85 - 1.92 |
1.1485 times |
Fri 03 October 2025 |
1.85 (-0.54%) |
1.87 |
1.85 - 1.90 |
0.856 times |
Fri 26 September 2025 |
1.86 (-1.06%) |
1.88 |
1.85 - 1.90 |
1.8358 times |
Fri 19 September 2025 |
1.88 (0%) |
1.90 |
1.86 - 1.91 |
0.9963 times |
Fri 12 September 2025 |
1.88 (0%) |
1.89 |
1.86 - 1.90 |
0.7866 times |
Fri 05 September 2025 |
1.88 (3.3%) |
1.83 |
1.83 - 1.90 |
0.7018 times |
Fri 29 August 2025 |
1.82 (0%) |
1.82 |
1.81 - 1.84 |
0.1644 times |
Fri 29 August 2025 |
1.82 (-2.67%) |
1.84 |
1.81 - 1.88 |
1.0417 times |
Fri 22 August 2025 |
1.87 (-0.53%) |
1.89 |
1.85 - 1.89 |
0.9046 times |

Monthly price and charts Renesola Strong monthly Stock price targets for Renesola SOL are 1.78 and 1.89 | Monthly Target 1 | 1.75 | | Monthly Target 2 | 1.8 | | Monthly Target 3 | 1.86 | | Monthly Target 4 | 1.91 | | Monthly Target 5 | 1.97 |
Monthly price and volumes Renesola
| Date |
Closing |
Open |
Range |
Volume |
Wed 22 October 2025 |
1.85 (-2.12%) |
1.89 |
1.81 - 1.92 |
0.5623 times |
Tue 30 September 2025 |
1.89 (3.85%) |
1.83 |
1.83 - 1.91 |
0.6125 times |
Fri 29 August 2025 |
1.82 (-2.67%) |
1.82 |
1.81 - 1.91 |
0.6168 times |
Thu 31 July 2025 |
1.87 (0%) |
1.87 |
1.87 - 1.95 |
1.0552 times |
Mon 30 June 2025 |
1.87 (4.47%) |
1.78 |
1.64 - 1.91 |
1.2972 times |
Fri 30 May 2025 |
1.79 (32.59%) |
1.30 |
1.30 - 1.87 |
0.6246 times |
Wed 30 April 2025 |
1.35 (-14.01%) |
1.55 |
1.16 - 1.66 |
0.7964 times |
Mon 31 March 2025 |
1.57 (-1.26%) |
1.64 |
1.04 - 1.80 |
2.7029 times |
Fri 28 February 2025 |
1.59 (-14.97%) |
1.82 |
1.56 - 1.88 |
0.663 times |
Fri 31 January 2025 |
1.87 (-7.88%) |
2.05 |
1.78 - 2.30 |
1.0691 times |
Tue 31 December 2024 |
2.03 (11.54%) |
1.90 |
1.65 - 2.17 |
0.9043 times |

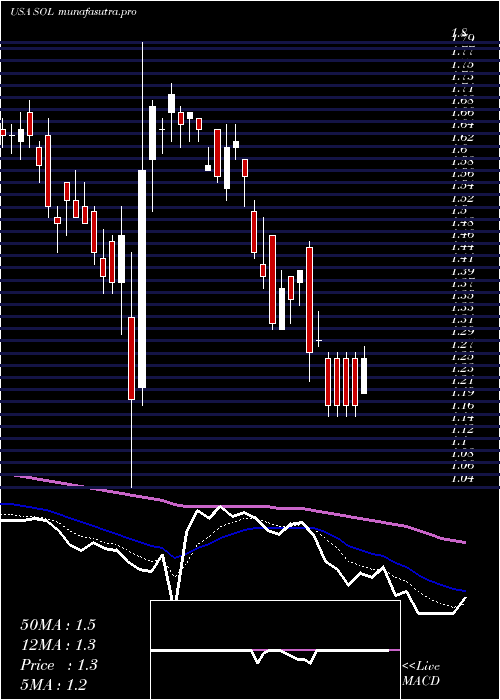
DMA SMA EMA moving averages of Renesola SOL
DMA (daily moving average) of Renesola SOL
| DMA period | DMA value | | 5 day DMA | 1.85 | | 12 day DMA | 1.86 | | 20 day DMA | 1.87 | | 35 day DMA | 1.87 | | 50 day DMA | 1.87 | | 100 day DMA | 1.86 | | 150 day DMA | 1.72 | | 200 day DMA | 1.74 | EMA (exponential moving average) of Renesola SOL
| EMA period | EMA current | EMA prev | EMA prev2 | | 5 day EMA | 1.86 | 1.86 | 1.85 | | 12 day EMA | 1.86 | 1.86 | 1.86 | | 20 day EMA | 1.86 | 1.86 | 1.86 | | 35 day EMA | 1.87 | 1.87 | 1.87 | | 50 day EMA | 1.87 | 1.87 | 1.87 |
SMA (simple moving average) of Renesola SOL
| SMA period | SMA current | SMA prev | SMA prev2 | | 5 day SMA | 1.85 | 1.85 | 1.85 | | 12 day SMA | 1.86 | 1.86 | 1.86 | | 20 day SMA | 1.87 | 1.87 | 1.87 | | 35 day SMA | 1.87 | 1.87 | 1.87 | | 50 day SMA | 1.87 | 1.87 | 1.87 | | 100 day SMA | 1.86 | 1.85 | 1.85 | | 150 day SMA | 1.72 | 1.72 | 1.71 | | 200 day SMA | 1.74 | 1.74 | 1.74 |
|
|
