SouthernCompany SOJC full analysis,charts,indicators,moving averages,SMA,DMA,EMA,ADX,MACD,RSISouthern Company SOJC WideScreen charts, DMA,SMA,EMA technical analysis, forecast prediction, by indicators ADX,MACD,RSI,CCI USA stock exchange
operates under Public Utilities sector & deals in Electric Utilities Central
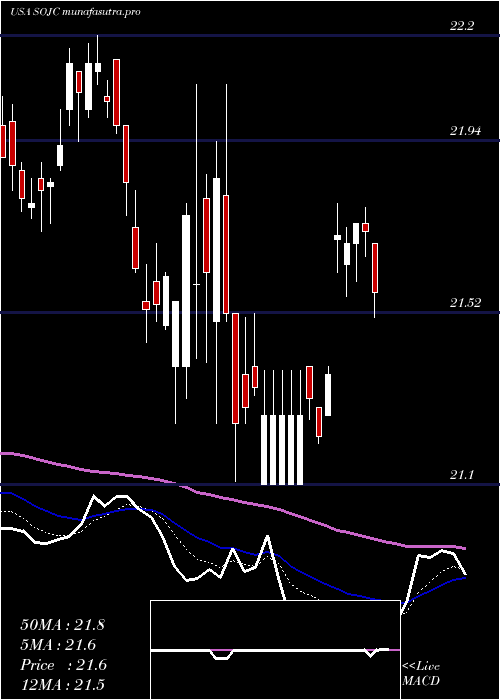
Daily price and charts and targets SouthernCompany Strong Daily Stock price targets for SouthernCompany SOJC are 21.48 and 21.67 | Daily Target 1 | 21.44 | | Daily Target 2 | 21.51 | | Daily Target 3 | 21.633333333333 | | Daily Target 4 | 21.7 | | Daily Target 5 | 21.82 |
Daily price and volume Southern Company
| Date |
Closing |
Open |
Range |
Volume |
Thu 04 December 2025 |
21.57 (-0.6%) |
21.68 |
21.57 - 21.76 |
0.8733 times |
Wed 03 December 2025 |
21.70 (0.23%) |
21.71 |
21.62 - 21.76 |
1.0592 times |
Tue 02 December 2025 |
21.65 (0.23%) |
21.65 |
21.54 - 21.70 |
1.3193 times |
Mon 01 December 2025 |
21.60 (-0.37%) |
21.63 |
21.60 - 21.70 |
1.6507 times |
Fri 28 November 2025 |
21.68 (-1.9%) |
21.78 |
21.58 - 21.89 |
1.6445 times |
Wed 26 November 2025 |
22.10 (0.18%) |
22.12 |
22.07 - 22.22 |
0.9198 times |
Tue 25 November 2025 |
22.06 (0.23%) |
22.02 |
22.01 - 22.17 |
0.6813 times |
Mon 24 November 2025 |
22.01 (0.23%) |
22.08 |
21.95 - 22.08 |
0.5513 times |
Fri 21 November 2025 |
21.96 (0.6%) |
21.83 |
21.76 - 22.04 |
0.48 times |
Thu 20 November 2025 |
21.83 (-0.59%) |
22.00 |
21.77 - 22.10 |
0.8207 times |
Wed 19 November 2025 |
21.96 (-0.18%) |
21.91 |
21.88 - 22.00 |
0.5017 times |
Weekly price and charts SouthernCompany Strong weekly Stock price targets for SouthernCompany SOJC are 21.45 and 21.67 | Weekly Target 1 | 21.4 | | Weekly Target 2 | 21.49 | | Weekly Target 3 | 21.623333333333 | | Weekly Target 4 | 21.71 | | Weekly Target 5 | 21.84 |
Weekly price and volumes for Southern Company
| Date |
Closing |
Open |
Range |
Volume |
Thu 04 December 2025 |
21.57 (-0.51%) |
21.63 |
21.54 - 21.76 |
1.5835 times |
Fri 28 November 2025 |
21.68 (-1.28%) |
22.08 |
21.58 - 22.22 |
1.2264 times |
Fri 21 November 2025 |
21.96 (-1.57%) |
22.24 |
21.76 - 22.32 |
1.0273 times |
Fri 14 November 2025 |
22.31 (-1.11%) |
22.63 |
22.28 - 22.87 |
1.0323 times |
Fri 07 November 2025 |
22.56 (-0.35%) |
22.55 |
22.43 - 22.75 |
0.8883 times |
Fri 31 October 2025 |
22.64 (0%) |
22.70 |
22.57 - 22.83 |
0.4651 times |
Fri 31 October 2025 |
22.64 (-1.74%) |
23.04 |
22.57 - 23.12 |
1.0883 times |
Fri 24 October 2025 |
23.04 (0.83%) |
22.93 |
22.85 - 23.09 |
0.9573 times |
Fri 17 October 2025 |
22.85 (1.51%) |
22.63 |
22.58 - 22.93 |
0.9493 times |
Fri 10 October 2025 |
22.51 (-2.22%) |
22.91 |
22.51 - 23.04 |
0.7821 times |
Fri 03 October 2025 |
23.02 (0.04%) |
23.01 |
22.61 - 23.23 |
1.4877 times |

Monthly price and charts SouthernCompany Strong monthly Stock price targets for SouthernCompany SOJC are 21.45 and 21.67 | Monthly Target 1 | 21.4 | | Monthly Target 2 | 21.49 | | Monthly Target 3 | 21.623333333333 | | Monthly Target 4 | 21.71 | | Monthly Target 5 | 21.84 |
Monthly price and volumes Southern Company
| Date |
Closing |
Open |
Range |
Volume |
Thu 04 December 2025 |
21.57 (-0.51%) |
21.63 |
21.54 - 21.76 |
0.3102 times |
Fri 28 November 2025 |
21.68 (-4.24%) |
22.55 |
21.58 - 22.87 |
0.8179 times |
Fri 31 October 2025 |
22.64 (-0.35%) |
22.80 |
22.51 - 23.23 |
0.9433 times |
Tue 30 September 2025 |
22.72 (-0.35%) |
22.75 |
22.61 - 24.04 |
1.0127 times |
Fri 29 August 2025 |
22.80 (1.29%) |
22.51 |
22.46 - 23.54 |
1.0107 times |
Thu 31 July 2025 |
22.51 (5.63%) |
21.35 |
21.35 - 22.51 |
0.977 times |
Mon 30 June 2025 |
21.31 (0.52%) |
21.16 |
21.05 - 21.64 |
1.1932 times |
Fri 30 May 2025 |
21.20 (-1.72%) |
21.60 |
21.08 - 21.76 |
1.0893 times |
Wed 30 April 2025 |
21.57 (0.19%) |
21.60 |
21.10 - 22.08 |
1.2774 times |
Mon 31 March 2025 |
21.53 (-2.4%) |
22.15 |
21.45 - 22.22 |
1.3685 times |
Fri 28 February 2025 |
22.06 (-0.9%) |
22.19 |
21.81 - 22.51 |
0.9168 times |

DMA SMA EMA moving averages of Southern Company SOJC
DMA (daily moving average) of Southern Company SOJC
| DMA period | DMA value | | 5 day DMA | 21.64 | | 12 day DMA | 21.84 | | 20 day DMA | 22.11 | | 35 day DMA | 22.43 | | 50 day DMA | 22.57 | | 100 day DMA | 22.78 | | 150 day DMA | 22.36 | | 200 day DMA | 22.21 | EMA (exponential moving average) of Southern Company SOJC
| EMA period | EMA current | EMA prev | EMA prev2 | | 5 day EMA | 21.68 | 21.74 | 21.76 | | 12 day EMA | 21.86 | 21.91 | 21.95 | | 20 day EMA | 22.05 | 22.1 | 22.14 | | 35 day EMA | 22.32 | 22.36 | 22.4 | | 50 day EMA | 22.58 | 22.62 | 22.66 |
SMA (simple moving average) of Southern Company SOJC
| SMA period | SMA current | SMA prev | SMA prev2 | | 5 day SMA | 21.64 | 21.75 | 21.82 | | 12 day SMA | 21.84 | 21.88 | 21.93 | | 20 day SMA | 22.11 | 22.16 | 22.21 | | 35 day SMA | 22.43 | 22.46 | 22.49 | | 50 day SMA | 22.57 | 22.61 | 22.64 | | 100 day SMA | 22.78 | 22.78 | 22.78 | | 150 day SMA | 22.36 | 22.36 | 22.36 | | 200 day SMA | 22.21 | 22.21 | 22.22 |
|
|
