SouthernCompany SO full analysis,charts,indicators,moving averages,SMA,DMA,EMA,ADX,MACD,RSISouthern Company SO WideScreen charts, DMA,SMA,EMA technical analysis, forecast prediction, by indicators ADX,MACD,RSI,CCI USA stock exchange
operates under Public Utilities sector & deals in Electric Utilities Central
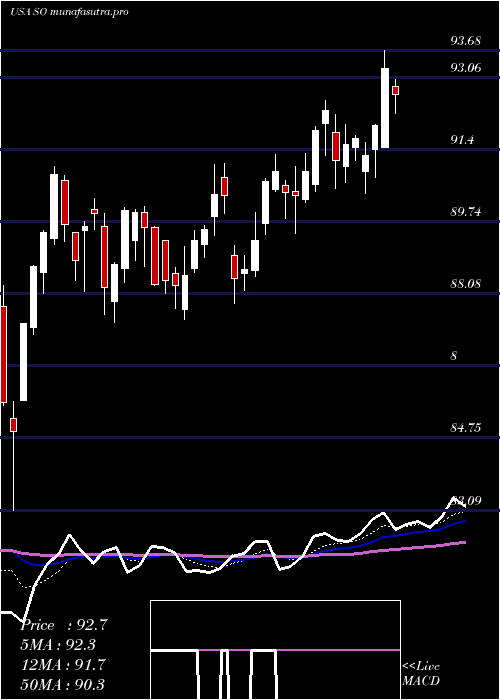
Daily price and charts and targets SouthernCompany Strong Daily Stock price targets for SouthernCompany SO are 86.32 and 87.98 | Daily Target 1 | 85.98 | | Daily Target 2 | 86.65 | | Daily Target 3 | 87.636666666667 | | Daily Target 4 | 88.31 | | Daily Target 5 | 89.3 |
Daily price and volume Southern Company
| Date |
Closing |
Open |
Range |
Volume |
Thu 04 December 2025 |
87.33 (-0.74%) |
87.74 |
86.96 - 88.62 |
1.3449 times |
Wed 03 December 2025 |
87.98 (-1.19%) |
89.23 |
87.07 - 90.34 |
1.9217 times |
Tue 02 December 2025 |
89.04 (0.03%) |
88.92 |
88.32 - 89.30 |
0.4436 times |
Mon 01 December 2025 |
89.01 (-2.32%) |
90.62 |
88.99 - 90.75 |
1.0104 times |
Fri 28 November 2025 |
91.12 (0.99%) |
90.39 |
90.26 - 91.12 |
0.4479 times |
Wed 26 November 2025 |
90.23 (1.05%) |
89.46 |
89.46 - 90.40 |
0.2986 times |
Tue 25 November 2025 |
89.29 (0.17%) |
89.00 |
88.62 - 89.53 |
0.9426 times |
Mon 24 November 2025 |
89.14 (-0.15%) |
89.59 |
88.20 - 89.72 |
1.0624 times |
Fri 21 November 2025 |
89.27 (0.79%) |
88.69 |
88.50 - 90.06 |
1.131 times |
Thu 20 November 2025 |
88.57 (-0.54%) |
89.23 |
88.43 - 89.50 |
1.3967 times |
Wed 19 November 2025 |
89.05 (-1.81%) |
90.78 |
88.90 - 90.81 |
0.8813 times |
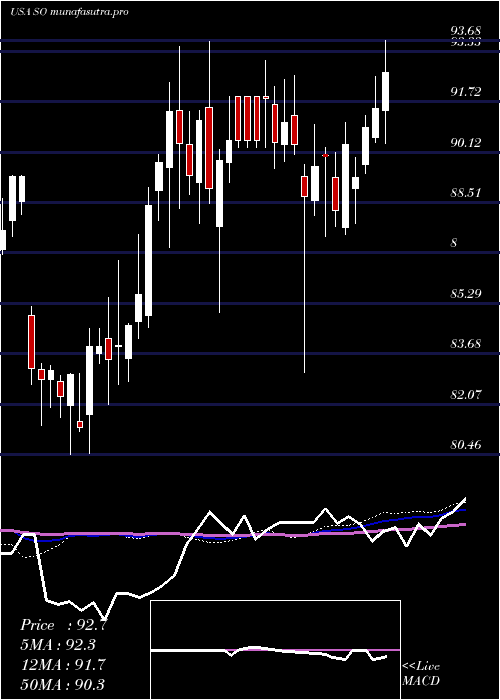
Weekly price and charts SouthernCompany Strong weekly Stock price targets for SouthernCompany SO are 85.25 and 89.04 | Weekly Target 1 | 84.56 | | Weekly Target 2 | 85.94 | | Weekly Target 3 | 88.346666666667 | | Weekly Target 4 | 89.73 | | Weekly Target 5 | 92.14 |
Weekly price and volumes for Southern Company
| Date |
Closing |
Open |
Range |
Volume |
Thu 04 December 2025 |
87.33 (-4.16%) |
90.62 |
86.96 - 90.75 |
1.1701 times |
Fri 28 November 2025 |
91.12 (2.07%) |
89.59 |
88.20 - 91.12 |
0.6821 times |
Fri 21 November 2025 |
89.27 (-1.57%) |
90.49 |
88.43 - 91.41 |
1.3112 times |
Fri 14 November 2025 |
90.69 (-0.82%) |
91.17 |
89.96 - 92.38 |
0.9896 times |
Fri 07 November 2025 |
91.44 (-2.76%) |
93.15 |
90.50 - 93.51 |
1.5042 times |
Fri 31 October 2025 |
94.04 (0%) |
94.48 |
93.60 - 94.68 |
0.2367 times |
Fri 31 October 2025 |
94.04 (-1.91%) |
95.70 |
92.85 - 95.70 |
1.2772 times |
Fri 24 October 2025 |
95.87 (-1.97%) |
98.40 |
95.84 - 98.41 |
0.7481 times |
Fri 17 October 2025 |
97.80 (-0.5%) |
97.62 |
97.19 - 100.84 |
1.104 times |
Fri 10 October 2025 |
98.29 (3.97%) |
94.55 |
93.00 - 98.36 |
0.9768 times |
Fri 03 October 2025 |
94.54 (0.01%) |
94.50 |
93.45 - 95.38 |
1.2854 times |
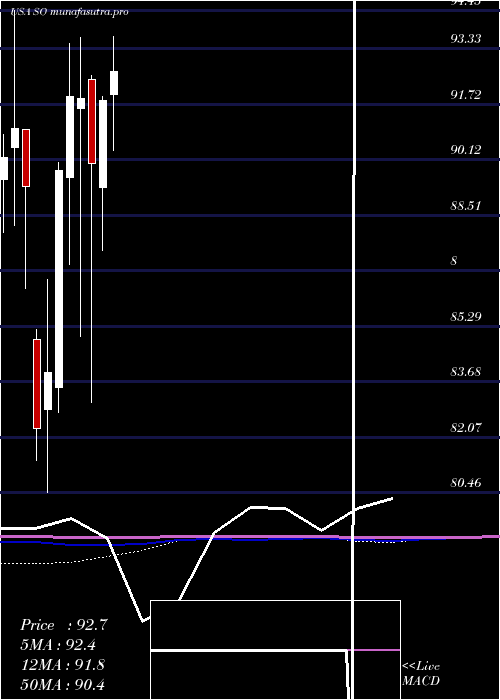
Monthly price and charts SouthernCompany Strong monthly Stock price targets for SouthernCompany SO are 85.25 and 89.04 | Monthly Target 1 | 84.56 | | Monthly Target 2 | 85.94 | | Monthly Target 3 | 88.346666666667 | | Monthly Target 4 | 89.73 | | Monthly Target 5 | 92.14 |
Monthly price and volumes Southern Company
| Date |
Closing |
Open |
Range |
Volume |
Thu 04 December 2025 |
87.33 (-4.16%) |
90.62 |
86.96 - 90.75 |
0.2765 times |
Fri 28 November 2025 |
91.12 (-3.11%) |
93.15 |
88.20 - 93.51 |
1.0603 times |
Fri 31 October 2025 |
94.04 (-0.77%) |
94.92 |
92.85 - 100.84 |
1.1706 times |
Tue 30 September 2025 |
94.77 (2.68%) |
92.24 |
90.35 - 95.06 |
1.0892 times |
Fri 29 August 2025 |
92.30 (-2.31%) |
95.24 |
92.07 - 96.42 |
0.9746 times |
Thu 31 July 2025 |
94.48 (2.89%) |
92.00 |
90.38 - 96.44 |
1.1939 times |
Mon 30 June 2025 |
91.83 (2.03%) |
89.30 |
87.49 - 91.94 |
1.0702 times |
Fri 30 May 2025 |
90.00 (-2.06%) |
92.44 |
83.09 - 92.56 |
1.1901 times |
Wed 30 April 2025 |
91.89 (-0.07%) |
91.60 |
85.00 - 93.65 |
0.9615 times |
Mon 31 March 2025 |
91.95 (2.41%) |
89.61 |
87.09 - 93.48 |
1.0132 times |
Fri 28 February 2025 |
89.79 (6.96%) |
83.52 |
82.78 - 90.03 |
0.9892 times |
DMA SMA EMA moving averages of Southern Company SO
DMA (daily moving average) of Southern Company SO
| DMA period | DMA value | | 5 day DMA | 88.9 | | 12 day DMA | 89.23 | | 20 day DMA | 89.97 | | 35 day DMA | 92.27 | | 50 day DMA | 93.39 | | 100 day DMA | 93.43 | | 150 day DMA | 92.3 | | 200 day DMA | 91.74 | EMA (exponential moving average) of Southern Company SO
| EMA period | EMA current | EMA prev | EMA prev2 | | 5 day EMA | 88.45 | 89.01 | 89.53 | | 12 day EMA | 89.31 | 89.67 | 89.98 | | 20 day EMA | 90.14 | 90.44 | 90.7 | | 35 day EMA | 91.43 | 91.67 | 91.89 | | 50 day EMA | 92.89 | 93.12 | 93.33 |
SMA (simple moving average) of Southern Company SO
| SMA period | SMA current | SMA prev | SMA prev2 | | 5 day SMA | 88.9 | 89.48 | 89.74 | | 12 day SMA | 89.23 | 89.5 | 89.72 | | 20 day SMA | 89.97 | 90.17 | 90.41 | | 35 day SMA | 92.27 | 92.62 | 92.96 | | 50 day SMA | 93.39 | 93.53 | 93.65 | | 100 day SMA | 93.43 | 93.48 | 93.53 | | 150 day SMA | 92.3 | 92.33 | 92.35 | | 200 day SMA | 91.74 | 91.73 | 91.72 |
|
|
