Sanofi SNY full analysis,charts,indicators,moving averages,SMA,DMA,EMA,ADX,MACD,RSISanofi SNY WideScreen charts, DMA,SMA,EMA technical analysis, forecast prediction, by indicators ADX,MACD,RSI,CCI USA stock exchange
operates under Health Care sector & deals in Major Pharmaceuticals
Daily price and charts and targets Sanofi Strong Daily Stock price targets for Sanofi SNY are 48.56 and 49.24 | Daily Target 1 | 48.44 | | Daily Target 2 | 48.67 | | Daily Target 3 | 49.12 | | Daily Target 4 | 49.35 | | Daily Target 5 | 49.8 |
Daily price and volume Sanofi
| Date |
Closing |
Open |
Range |
Volume |
Thu 04 December 2025 |
48.90 (-1.59%) |
49.51 |
48.89 - 49.57 |
0.788 times |
Wed 03 December 2025 |
49.69 (-0.32%) |
49.63 |
49.59 - 49.91 |
1.7836 times |
Tue 02 December 2025 |
49.85 (-0.2%) |
50.42 |
49.67 - 50.43 |
0.595 times |
Mon 01 December 2025 |
49.95 (0.14%) |
50.26 |
49.88 - 50.42 |
0.7886 times |
Fri 28 November 2025 |
49.88 (-0.3%) |
49.80 |
49.62 - 49.93 |
0.4737 times |
Wed 26 November 2025 |
50.03 (-0.5%) |
49.61 |
49.50 - 50.09 |
0.6554 times |
Tue 25 November 2025 |
50.28 (2.3%) |
50.02 |
49.25 - 50.61 |
1.5265 times |
Mon 24 November 2025 |
49.15 (-0.97%) |
49.52 |
49.14 - 49.89 |
1.0719 times |
Fri 21 November 2025 |
49.63 (1.51%) |
49.52 |
49.34 - 49.75 |
1.3247 times |
Thu 20 November 2025 |
48.89 (-1.33%) |
49.76 |
48.73 - 49.93 |
0.9925 times |
Wed 19 November 2025 |
49.55 (-2.19%) |
50.39 |
49.29 - 50.52 |
1.4955 times |
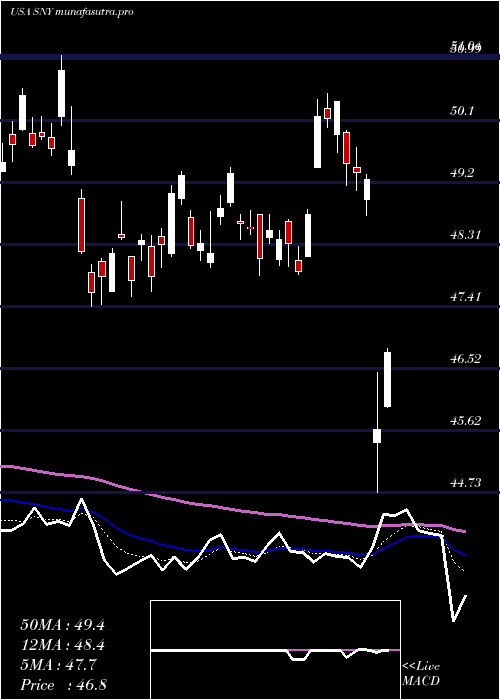
Weekly price and charts Sanofi Strong weekly Stock price targets for Sanofi SNY are 48.13 and 49.67 | Weekly Target 1 | 47.87 | | Weekly Target 2 | 48.38 | | Weekly Target 3 | 49.406666666667 | | Weekly Target 4 | 49.92 | | Weekly Target 5 | 50.95 |
Weekly price and volumes for Sanofi
| Date |
Closing |
Open |
Range |
Volume |
Thu 04 December 2025 |
48.90 (-1.96%) |
50.26 |
48.89 - 50.43 |
0.9472 times |
Fri 28 November 2025 |
49.88 (0.5%) |
49.52 |
49.14 - 50.61 |
0.8927 times |
Fri 21 November 2025 |
49.63 (-4.81%) |
51.78 |
48.73 - 52.67 |
1.3371 times |
Fri 14 November 2025 |
52.14 (4.99%) |
50.00 |
49.98 - 52.68 |
0.8273 times |
Fri 07 November 2025 |
49.66 (-1.82%) |
48.77 |
48.54 - 49.80 |
0.8012 times |
Fri 31 October 2025 |
50.58 (0%) |
50.69 |
50.19 - 50.88 |
0.2071 times |
Fri 31 October 2025 |
50.58 (-2.05%) |
51.40 |
50.19 - 51.70 |
1.1177 times |
Fri 24 October 2025 |
51.64 (2.02%) |
50.05 |
49.43 - 52.20 |
1.4391 times |
Fri 17 October 2025 |
50.62 (5.26%) |
48.34 |
48.26 - 50.72 |
1.1435 times |
Fri 10 October 2025 |
48.09 (-5.52%) |
50.12 |
47.85 - 50.54 |
1.2871 times |
Fri 03 October 2025 |
50.90 (11.77%) |
45.66 |
44.62 - 51.05 |
2.3371 times |

Monthly price and charts Sanofi Strong monthly Stock price targets for Sanofi SNY are 48.13 and 49.67 | Monthly Target 1 | 47.87 | | Monthly Target 2 | 48.38 | | Monthly Target 3 | 49.406666666667 | | Monthly Target 4 | 49.92 | | Monthly Target 5 | 50.95 |
Monthly price and volumes Sanofi
| Date |
Closing |
Open |
Range |
Volume |
Thu 04 December 2025 |
48.90 (-1.96%) |
50.26 |
48.89 - 50.43 |
0.193 times |
Fri 28 November 2025 |
49.88 (-1.38%) |
48.77 |
48.54 - 52.68 |
0.7862 times |
Fri 31 October 2025 |
50.58 (7.16%) |
48.58 |
47.85 - 52.20 |
1.2891 times |
Tue 30 September 2025 |
47.20 (-4.61%) |
49.67 |
44.62 - 50.38 |
1.7005 times |
Fri 29 August 2025 |
49.48 (8.41%) |
45.98 |
45.97 - 51.60 |
0.9367 times |
Thu 31 July 2025 |
45.64 (-5.53%) |
48.19 |
44.73 - 50.49 |
0.9111 times |
Mon 30 June 2025 |
48.31 (-2.15%) |
48.99 |
47.42 - 51.04 |
0.811 times |
Fri 30 May 2025 |
49.37 (-10.15%) |
55.10 |
48.59 - 55.73 |
0.9478 times |
Wed 30 April 2025 |
54.95 (-0.92%) |
55.50 |
47.70 - 55.77 |
1.3815 times |
Mon 31 March 2025 |
55.46 (1.82%) |
56.27 |
54.60 - 60.12 |
1.0432 times |
Fri 28 February 2025 |
54.47 (0.24%) |
53.42 |
52.69 - 55.20 |
0.7601 times |

DMA SMA EMA moving averages of Sanofi SNY
DMA (daily moving average) of Sanofi SNY
| DMA period | DMA value | | 5 day DMA | 49.65 | | 12 day DMA | 49.71 | | 20 day DMA | 50.31 | | 35 day DMA | 50.31 | | 50 day DMA | 49.73 | | 100 day DMA | 49.06 | | 150 day DMA | 49.44 | | 200 day DMA | 50.72 | EMA (exponential moving average) of Sanofi SNY
| EMA period | EMA current | EMA prev | EMA prev2 | | 5 day EMA | 49.52 | 49.83 | 49.9 | | 12 day EMA | 49.83 | 50 | 50.06 | | 20 day EMA | 49.98 | 50.09 | 50.13 | | 35 day EMA | 49.77 | 49.82 | 49.83 | | 50 day EMA | 49.51 | 49.53 | 49.52 |
SMA (simple moving average) of Sanofi SNY
| SMA period | SMA current | SMA prev | SMA prev2 | | 5 day SMA | 49.65 | 49.88 | 50 | | 12 day SMA | 49.71 | 49.95 | 50.15 | | 20 day SMA | 50.31 | 50.31 | 50.28 | | 35 day SMA | 50.31 | 50.31 | 50.29 | | 50 day SMA | 49.73 | 49.68 | 49.62 | | 100 day SMA | 49.06 | 49.05 | 49.04 | | 150 day SMA | 49.44 | 49.48 | 49.51 | | 200 day SMA | 50.72 | 50.75 | 50.77 |
|
|
