SynnexCorporation SNX full analysis,charts,indicators,moving averages,SMA,DMA,EMA,ADX,MACD,RSISynnex Corporation SNX WideScreen charts, DMA,SMA,EMA technical analysis, forecast prediction, by indicators ADX,MACD,RSI,CCI USA stock exchange
operates under Technology sector & deals in Retail Computer Software Peripheral Equipment
Daily price and charts and targets SynnexCorporation Strong Daily Stock price targets for SynnexCorporation SNX are 153.79 and 157.38 | Daily Target 1 | 151.16 | | Daily Target 2 | 152.82 | | Daily Target 3 | 154.74666666667 | | Daily Target 4 | 156.41 | | Daily Target 5 | 158.34 |
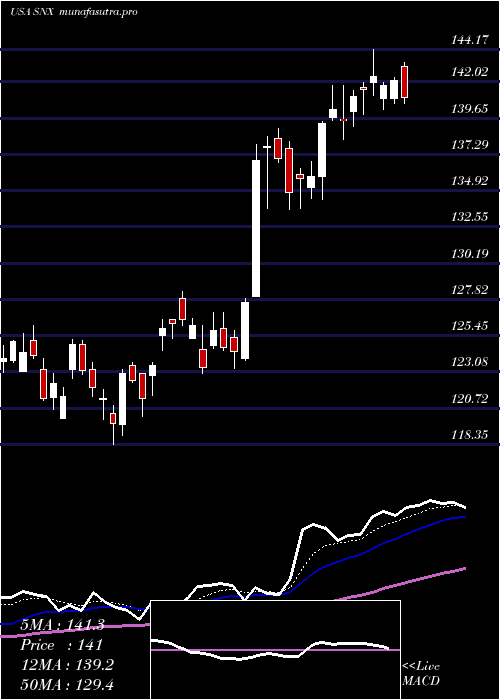
Daily price and volume Synnex Corporation
| Date |
Closing |
Open |
Range |
Volume |
Thu 04 December 2025 |
154.49 (0.31%) |
153.38 |
153.08 - 156.67 |
1.261 times |
Wed 03 December 2025 |
154.01 (0.29%) |
153.54 |
152.48 - 154.15 |
1.1561 times |
Tue 02 December 2025 |
153.56 (1.23%) |
153.22 |
151.22 - 153.89 |
0.8935 times |
Mon 01 December 2025 |
151.69 (-0.52%) |
151.85 |
151.45 - 153.26 |
0.9426 times |
Fri 28 November 2025 |
152.48 (0.38%) |
152.60 |
150.74 - 153.37 |
0.4314 times |
Wed 26 November 2025 |
151.90 (-0.09%) |
152.07 |
151.45 - 153.57 |
0.9431 times |
Tue 25 November 2025 |
152.03 (1.45%) |
150.88 |
149.65 - 152.43 |
0.7228 times |
Mon 24 November 2025 |
149.85 (2.47%) |
146.84 |
145.66 - 150.11 |
1.4782 times |
Fri 21 November 2025 |
146.24 (2.68%) |
142.84 |
142.45 - 147.09 |
1.0978 times |
Thu 20 November 2025 |
142.42 (-3.23%) |
150.09 |
142.22 - 151.27 |
1.0734 times |
Wed 19 November 2025 |
147.18 (0.26%) |
146.07 |
145.40 - 148.48 |
0.8801 times |
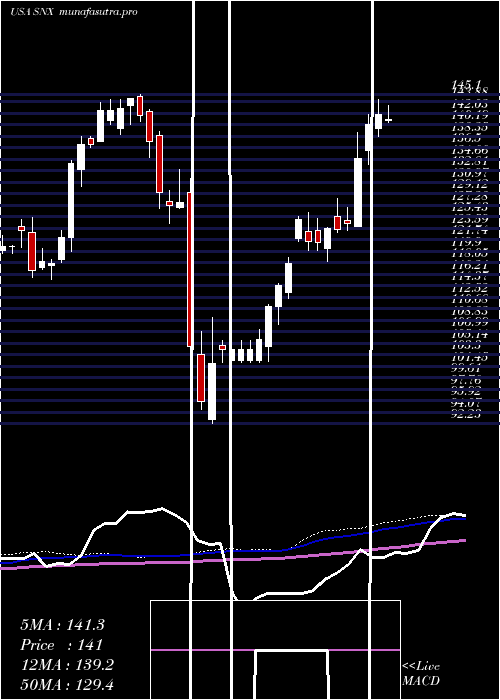
Weekly price and charts SynnexCorporation Strong weekly Stock price targets for SynnexCorporation SNX are 152.86 and 158.31 | Weekly Target 1 | 148.68 | | Weekly Target 2 | 151.58 | | Weekly Target 3 | 154.12666666667 | | Weekly Target 4 | 157.03 | | Weekly Target 5 | 159.58 |
Weekly price and volumes for Synnex Corporation
| Date |
Closing |
Open |
Range |
Volume |
Thu 04 December 2025 |
154.49 (1.32%) |
151.85 |
151.22 - 156.67 |
1.088 times |
Fri 28 November 2025 |
152.48 (4.27%) |
146.84 |
145.66 - 153.57 |
0.9147 times |
Fri 21 November 2025 |
146.24 (-2.95%) |
150.17 |
142.22 - 151.27 |
1.1864 times |
Fri 14 November 2025 |
150.68 (-0.57%) |
153.35 |
148.59 - 154.81 |
1.1916 times |
Fri 07 November 2025 |
151.55 (-3.16%) |
151.22 |
148.27 - 154.53 |
1.0779 times |
Fri 31 October 2025 |
156.49 (0%) |
155.59 |
155.28 - 157.21 |
0.2228 times |
Fri 31 October 2025 |
156.49 (0.99%) |
156.21 |
153.63 - 159.36 |
1.2437 times |
Fri 24 October 2025 |
154.96 (1.14%) |
154.67 |
150.96 - 156.40 |
1.2069 times |
Fri 17 October 2025 |
153.21 (-3.43%) |
154.36 |
151.68 - 158.02 |
1.3887 times |
Tue 07 October 2025 |
158.65 (-0.01%) |
160.50 |
157.80 - 161.90 |
0.4792 times |
Fri 03 October 2025 |
158.66 (-3.55%) |
165.00 |
158.09 - 168.68 |
2.1896 times |
Monthly price and charts SynnexCorporation Strong monthly Stock price targets for SynnexCorporation SNX are 152.86 and 158.31 | Monthly Target 1 | 148.68 | | Monthly Target 2 | 151.58 | | Monthly Target 3 | 154.12666666667 | | Monthly Target 4 | 157.03 | | Monthly Target 5 | 159.58 |
Monthly price and volumes Synnex Corporation
| Date |
Closing |
Open |
Range |
Volume |
Thu 04 December 2025 |
154.49 (1.32%) |
151.85 |
151.22 - 156.67 |
0.1692 times |
Fri 28 November 2025 |
152.48 (-2.56%) |
151.22 |
142.22 - 154.81 |
0.6796 times |
Fri 31 October 2025 |
156.49 (-4.43%) |
161.16 |
150.96 - 168.68 |
0.8881 times |
Tue 30 September 2025 |
163.75 (10.59%) |
145.69 |
144.39 - 167.76 |
1.3766 times |
Fri 29 August 2025 |
148.07 (2.55%) |
142.16 |
139.23 - 153.70 |
0.8081 times |
Thu 31 July 2025 |
144.39 (6.4%) |
135.14 |
134.31 - 149.76 |
0.9777 times |
Mon 30 June 2025 |
135.70 (11.83%) |
120.36 |
118.35 - 138.97 |
1.3814 times |
Fri 30 May 2025 |
121.34 (9.51%) |
111.90 |
111.02 - 126.12 |
0.7951 times |
Wed 30 April 2025 |
110.80 (6.58%) |
104.20 |
92.23 - 112.13 |
1.7527 times |
Mon 31 March 2025 |
103.96 (-24.39%) |
138.54 |
102.62 - 139.19 |
1.1714 times |
Fri 28 February 2025 |
137.49 (-3.52%) |
139.66 |
134.99 - 145.10 |
0.7086 times |
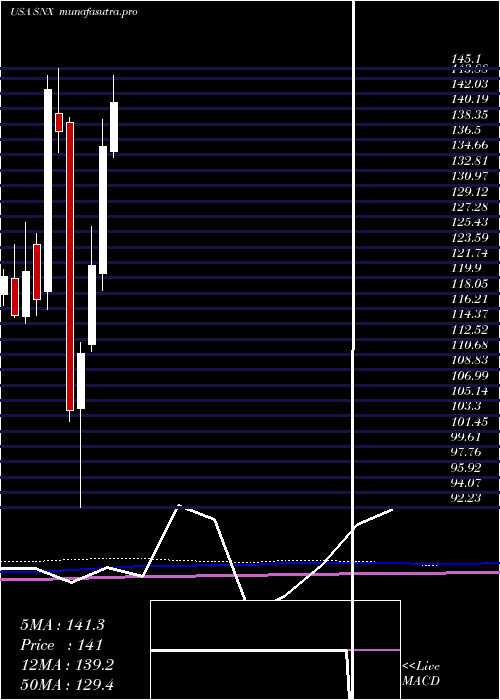
DMA SMA EMA moving averages of Synnex Corporation SNX
DMA (daily moving average) of Synnex Corporation SNX
| DMA period | DMA value | | 5 day DMA | 153.25 | | 12 day DMA | 150.22 | | 20 day DMA | 150.41 | | 35 day DMA | 152.12 | | 50 day DMA | 154.03 | | 100 day DMA | 150.54 | | 150 day DMA | 142.15 | | 200 day DMA | 136.58 | EMA (exponential moving average) of Synnex Corporation SNX
| EMA period | EMA current | EMA prev | EMA prev2 | | 5 day EMA | 153.24 | 152.61 | 151.91 | | 12 day EMA | 151.81 | 151.32 | 150.83 | | 20 day EMA | 151.61 | 151.31 | 151.03 | | 35 day EMA | 152.28 | 152.15 | 152.04 | | 50 day EMA | 153.65 | 153.62 | 153.6 |
SMA (simple moving average) of Synnex Corporation SNX
| SMA period | SMA current | SMA prev | SMA prev2 | | 5 day SMA | 153.25 | 152.73 | 152.33 | | 12 day SMA | 150.22 | 149.54 | 149.26 | | 20 day SMA | 150.41 | 150.35 | 150.19 | | 35 day SMA | 152.12 | 152.19 | 152.22 | | 50 day SMA | 154.03 | 153.94 | 153.87 | | 100 day SMA | 150.54 | 150.42 | 150.29 | | 150 day SMA | 142.15 | 141.86 | 141.57 | | 200 day SMA | 136.58 | 136.51 | 136.45 |
|
|
