SynopsysInc SNPS full analysis,charts,indicators,moving averages,SMA,DMA,EMA,ADX,MACD,RSISynopsys Inc SNPS WideScreen charts, DMA,SMA,EMA technical analysis, forecast prediction, by indicators ADX,MACD,RSI,CCI USA stock exchange
operates under Technology sector & deals in Computer Software Prepackaged Software
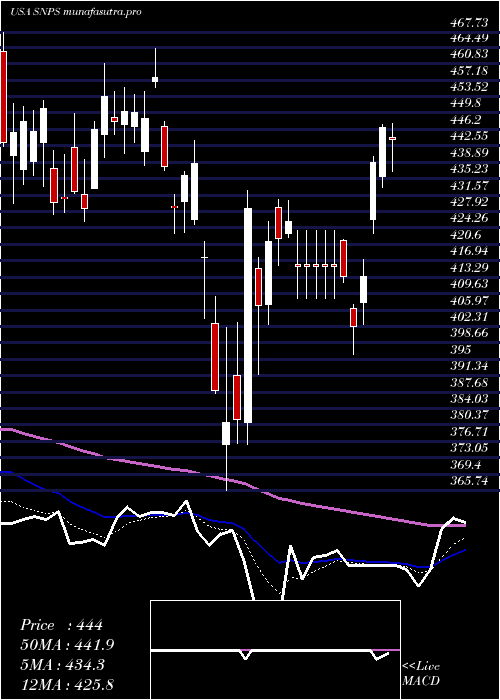
Daily price and charts and targets SynopsysInc Strong Daily Stock price targets for SynopsysInc SNPS are 451.19 and 460.01 | Daily Target 1 | 444.58 | | Daily Target 2 | 448.97 | | Daily Target 3 | 453.39666666667 | | Daily Target 4 | 457.79 | | Daily Target 5 | 462.22 |
Daily price and volume Synopsys Inc
| Date |
Closing |
Open |
Range |
Volume |
Mon 20 October 2025 |
453.37 (1.28%) |
450.01 |
449.00 - 457.82 |
0.2938 times |
Fri 17 October 2025 |
447.64 (2.63%) |
435.64 |
435.26 - 456.84 |
1.1956 times |
Thu 16 October 2025 |
436.19 (0.07%) |
439.55 |
435.37 - 445.54 |
0.5877 times |
Wed 15 October 2025 |
435.90 (-1.77%) |
446.26 |
432.00 - 448.89 |
1.481 times |
Tue 14 October 2025 |
443.76 (-0.95%) |
436.41 |
433.36 - 452.80 |
1.3991 times |
Mon 13 October 2025 |
448.00 (2.07%) |
449.48 |
440.00 - 453.80 |
1.0766 times |
Fri 10 October 2025 |
438.92 (-9.39%) |
484.41 |
437.27 - 487.58 |
1.709 times |
Thu 09 October 2025 |
484.41 (-1.01%) |
487.50 |
480.69 - 488.08 |
0.8228 times |
Wed 08 October 2025 |
489.36 (2.41%) |
476.81 |
476.72 - 492.36 |
0.8523 times |
Tue 07 October 2025 |
477.83 (0.37%) |
484.11 |
468.43 - 484.11 |
0.5821 times |
Mon 06 October 2025 |
476.08 (1.47%) |
470.09 |
469.55 - 481.23 |
0.4455 times |
Weekly price and charts SynopsysInc Strong weekly Stock price targets for SynopsysInc SNPS are 451.19 and 460.01 | Weekly Target 1 | 444.58 | | Weekly Target 2 | 448.97 | | Weekly Target 3 | 453.39666666667 | | Weekly Target 4 | 457.79 | | Weekly Target 5 | 462.22 |
Weekly price and volumes for Synopsys Inc
| Date |
Closing |
Open |
Range |
Volume |
Mon 20 October 2025 |
453.37 (1.28%) |
450.01 |
449.00 - 457.82 |
0.0459 times |
Fri 17 October 2025 |
447.64 (1.99%) |
449.48 |
432.00 - 456.84 |
0.8972 times |
Fri 10 October 2025 |
438.92 (-6.45%) |
470.09 |
437.27 - 492.36 |
0.6895 times |
Fri 03 October 2025 |
469.17 (-3.81%) |
488.00 |
466.59 - 495.72 |
0.845 times |
Fri 26 September 2025 |
487.76 (-1.56%) |
490.00 |
462.00 - 515.64 |
1.3813 times |
Fri 19 September 2025 |
495.50 (16.46%) |
431.50 |
416.79 - 498.05 |
1.8501 times |
Fri 12 September 2025 |
425.45 (-28.87%) |
600.92 |
380.84 - 615.79 |
3.5028 times |
Fri 05 September 2025 |
598.14 (-0.89%) |
589.05 |
584.00 - 615.75 |
0.3555 times |
Fri 29 August 2025 |
603.52 (0%) |
608.98 |
601.94 - 612.00 |
0.0739 times |
Fri 29 August 2025 |
603.52 (-0.49%) |
604.97 |
593.00 - 614.63 |
0.3588 times |
Fri 22 August 2025 |
606.52 (-1.84%) |
617.91 |
593.05 - 626.24 |
0.416 times |

Monthly price and charts SynopsysInc Strong monthly Stock price targets for SynopsysInc SNPS are 410.83 and 474.55 | Monthly Target 1 | 396.64 | | Monthly Target 2 | 425.01 | | Monthly Target 3 | 460.36333333333 | | Monthly Target 4 | 488.73 | | Monthly Target 5 | 524.08 |
Monthly price and volumes Synopsys Inc
| Date |
Closing |
Open |
Range |
Volume |
Mon 20 October 2025 |
453.37 (-8.11%) |
488.75 |
432.00 - 495.72 |
0.7763 times |
Tue 30 September 2025 |
493.39 (-18.25%) |
589.05 |
380.84 - 615.79 |
2.8218 times |
Fri 29 August 2025 |
603.52 (-4.73%) |
617.55 |
593.00 - 636.25 |
0.6118 times |
Thu 31 July 2025 |
633.47 (23.56%) |
509.21 |
506.08 - 651.73 |
1.4581 times |
Mon 30 June 2025 |
512.68 (10.5%) |
459.92 |
452.49 - 521.69 |
0.6295 times |
Fri 30 May 2025 |
463.98 (1.08%) |
462.47 |
437.69 - 521.10 |
0.8128 times |
Wed 30 April 2025 |
459.01 (7.03%) |
430.11 |
365.74 - 462.43 |
0.8248 times |
Mon 31 March 2025 |
428.85 (-6.22%) |
463.57 |
423.08 - 467.73 |
0.7444 times |
Fri 28 February 2025 |
457.28 (-12.98%) |
511.69 |
448.11 - 545.65 |
0.6246 times |
Fri 31 January 2025 |
525.48 (8.27%) |
494.04 |
479.00 - 556.31 |
0.6959 times |
Tue 31 December 2024 |
485.36 (-12.38%) |
515.29 |
478.84 - 525.33 |
0.4678 times |

DMA SMA EMA moving averages of Synopsys Inc SNPS
DMA (daily moving average) of Synopsys Inc SNPS
| DMA period | DMA value | | 5 day DMA | 443.37 | | 12 day DMA | 458.39 | | 20 day DMA | 468.49 | | 35 day DMA | 485.14 | | 50 day DMA | 522.35 | | 100 day DMA | 532.02 | | 150 day DMA | 505.51 | | 200 day DMA | 502.96 | EMA (exponential moving average) of Synopsys Inc SNPS
| EMA period | EMA current | EMA prev | EMA prev2 | | 5 day EMA | 448.24 | 445.67 | 444.68 | | 12 day EMA | 456.37 | 456.91 | 458.6 | | 20 day EMA | 467.44 | 468.92 | 471.16 | | 35 day EMA | 496.5 | 499.04 | 502.07 | | 50 day EMA | 522.71 | 525.54 | 528.72 |
SMA (simple moving average) of Synopsys Inc SNPS
| SMA period | SMA current | SMA prev | SMA prev2 | | 5 day SMA | 443.37 | 442.3 | 440.55 | | 12 day SMA | 458.39 | 459.94 | 463.37 | | 20 day SMA | 468.49 | 471.56 | 473.95 | | 35 day SMA | 485.14 | 489.43 | 493.88 | | 50 day SMA | 522.35 | 525.61 | 529.05 | | 100 day SMA | 532.02 | 532.6 | 533.11 | | 150 day SMA | 505.51 | 505.46 | 505.33 | | 200 day SMA | 502.96 | 503.11 | 503.29 |
|
|
