SenestechInc SNES full analysis,charts,indicators,moving averages,SMA,DMA,EMA,ADX,MACD,RSISenestech Inc SNES WideScreen charts, DMA,SMA,EMA technical analysis, forecast prediction, by indicators ADX,MACD,RSI,CCI USA stock exchange
operates under Basic Industries sector & deals in Agricultural Chemicals
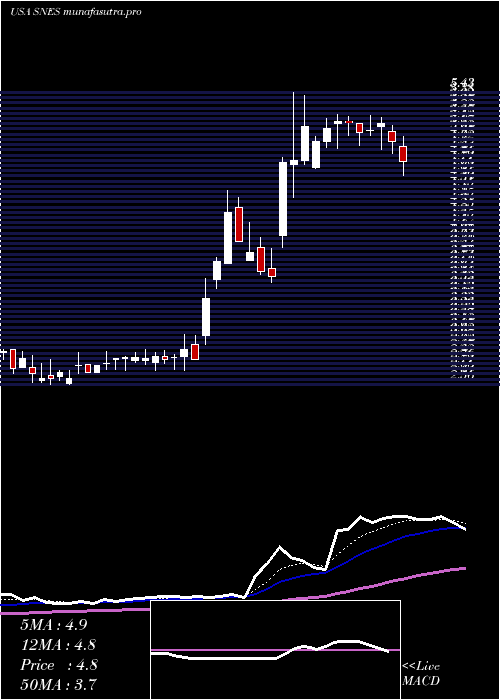
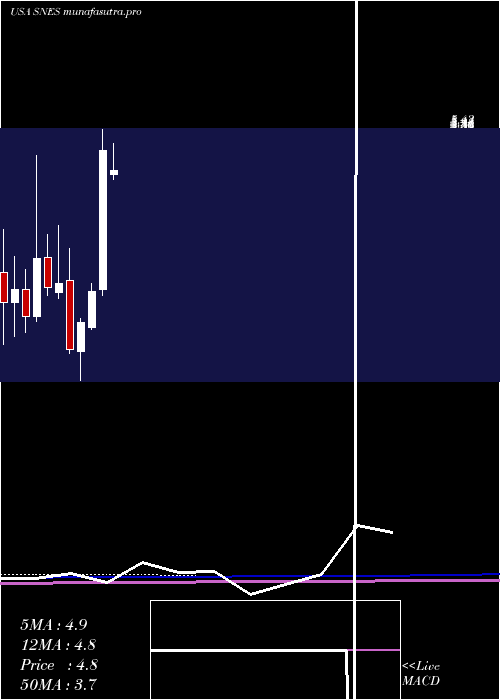
Daily price and charts and targets SenestechInc Strong Daily Stock price targets for SenestechInc SNES are 2.91 and 3.03 | Daily Target 1 | 2.82 | | Daily Target 2 | 2.88 | | Daily Target 3 | 2.9366666666667 | | Daily Target 4 | 3 | | Daily Target 5 | 3.06 |
Daily price and volume Senestech Inc
| Date |
Closing |
Open |
Range |
Volume |
Thu 04 December 2025 |
2.95 (2.43%) |
2.88 |
2.87 - 2.99 |
0.3367 times |
Wed 03 December 2025 |
2.88 (6.27%) |
2.64 |
2.64 - 2.99 |
0.6259 times |
Tue 02 December 2025 |
2.71 (1.12%) |
2.64 |
2.62 - 2.76 |
0.2734 times |
Mon 01 December 2025 |
2.68 (-7.9%) |
2.85 |
2.68 - 2.91 |
0.2755 times |
Fri 28 November 2025 |
2.91 (3.56%) |
2.86 |
2.83 - 2.92 |
0.3504 times |
Wed 26 November 2025 |
2.81 (-2.43%) |
2.75 |
2.69 - 2.87 |
0.3869 times |
Tue 25 November 2025 |
2.88 (3.6%) |
2.78 |
2.72 - 2.96 |
1.5738 times |
Mon 24 November 2025 |
2.78 (9.02%) |
2.57 |
2.57 - 2.97 |
1.7986 times |
Fri 21 November 2025 |
2.55 (4.94%) |
2.44 |
2.34 - 2.63 |
2.0133 times |
Thu 20 November 2025 |
2.43 (-4.71%) |
2.53 |
2.37 - 2.65 |
2.3657 times |
Wed 19 November 2025 |
2.55 (-7.94%) |
2.76 |
2.50 - 2.76 |
2.9591 times |
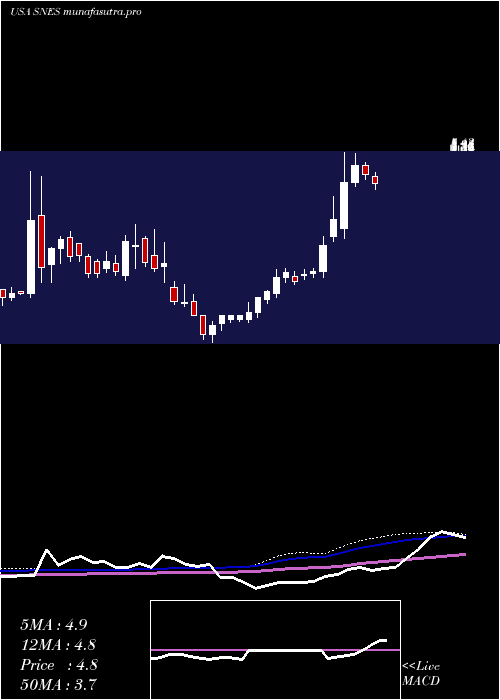
Weekly price and charts SenestechInc Strong weekly Stock price targets for SenestechInc SNES are 2.79 and 3.16 | Weekly Target 1 | 2.48 | | Weekly Target 2 | 2.72 | | Weekly Target 3 | 2.8533333333333 | | Weekly Target 4 | 3.09 | | Weekly Target 5 | 3.22 |
Weekly price and volumes for Senestech Inc
| Date |
Closing |
Open |
Range |
Volume |
Thu 04 December 2025 |
2.95 (1.37%) |
2.85 |
2.62 - 2.99 |
0.2231 times |
Fri 28 November 2025 |
2.91 (14.12%) |
2.57 |
2.57 - 2.97 |
0.6067 times |
Fri 21 November 2025 |
2.55 (-10.21%) |
2.86 |
2.34 - 2.86 |
1.4201 times |
Fri 14 November 2025 |
2.84 (-16.96%) |
3.54 |
2.60 - 3.61 |
2.0057 times |
Fri 07 November 2025 |
3.42 (3.01%) |
3.29 |
3.00 - 3.47 |
0.7316 times |
Fri 31 October 2025 |
3.32 (0%) |
3.35 |
3.20 - 3.42 |
0.3415 times |
Fri 31 October 2025 |
3.32 (-11.7%) |
3.77 |
3.20 - 3.80 |
1.0897 times |
Fri 24 October 2025 |
3.76 (0%) |
3.80 |
3.59 - 4.04 |
0.732 times |
Fri 17 October 2025 |
3.76 (-2.08%) |
3.91 |
3.63 - 4.28 |
0.8786 times |
Fri 10 October 2025 |
3.84 (1.86%) |
3.77 |
3.76 - 4.45 |
1.9709 times |
Fri 03 October 2025 |
3.77 (-18.75%) |
4.63 |
3.74 - 4.65 |
2.3474 times |
Monthly price and charts SenestechInc Strong monthly Stock price targets for SenestechInc SNES are 2.79 and 3.16 | Monthly Target 1 | 2.48 | | Monthly Target 2 | 2.72 | | Monthly Target 3 | 2.8533333333333 | | Monthly Target 4 | 3.09 | | Monthly Target 5 | 3.22 |
Monthly price and volumes Senestech Inc
| Date |
Closing |
Open |
Range |
Volume |
Thu 04 December 2025 |
2.95 (1.37%) |
2.85 |
2.62 - 2.99 |
0.0316 times |
Fri 28 November 2025 |
2.91 (-12.35%) |
3.29 |
2.34 - 3.61 |
0.6754 times |
Fri 31 October 2025 |
3.32 (-24.37%) |
4.38 |
3.20 - 4.45 |
0.9682 times |
Tue 30 September 2025 |
4.39 (-11.13%) |
4.94 |
4.27 - 5.35 |
1.0347 times |
Fri 29 August 2025 |
4.94 (-5.73%) |
5.15 |
4.30 - 5.65 |
1.1498 times |
Thu 31 July 2025 |
5.24 (2.95%) |
4.69 |
4.31 - 5.99 |
1.5414 times |
Mon 30 June 2025 |
5.09 (83.75%) |
2.80 |
2.70 - 5.43 |
2.0082 times |
Fri 30 May 2025 |
2.77 (23.11%) |
2.17 |
2.15 - 2.90 |
0.3224 times |
Wed 30 April 2025 |
2.25 (24.31%) |
1.78 |
1.30 - 2.33 |
0.326 times |
Mon 31 March 2025 |
1.81 (-37.59%) |
2.94 |
1.75 - 3.47 |
1.9424 times |
Fri 28 February 2025 |
2.90 (2.47%) |
2.75 |
2.65 - 3.86 |
1.0265 times |
DMA SMA EMA moving averages of Senestech Inc SNES
DMA (daily moving average) of Senestech Inc SNES
| DMA period | DMA value | | 5 day DMA | 2.83 | | 12 day DMA | 2.74 | | 20 day DMA | 2.87 | | 35 day DMA | 3.16 | | 50 day DMA | 3.47 | | 100 day DMA | 4.19 | | 150 day DMA | 3.94 | | 200 day DMA | 3.53 | EMA (exponential moving average) of Senestech Inc SNES
| EMA period | EMA current | EMA prev | EMA prev2 | | 5 day EMA | 2.84 | 2.79 | 2.75 | | 12 day EMA | 2.83 | 2.81 | 2.8 | | 20 day EMA | 2.93 | 2.93 | 2.94 | | 35 day EMA | 3.2 | 3.22 | 3.24 | | 50 day EMA | 3.5 | 3.52 | 3.55 |
SMA (simple moving average) of Senestech Inc SNES
| SMA period | SMA current | SMA prev | SMA prev2 | | 5 day SMA | 2.83 | 2.8 | 2.8 | | 12 day SMA | 2.74 | 2.73 | 2.72 | | 20 day SMA | 2.87 | 2.89 | 2.9 | | 35 day SMA | 3.16 | 3.2 | 3.23 | | 50 day SMA | 3.47 | 3.5 | 3.53 | | 100 day SMA | 4.19 | 4.21 | 4.23 | | 150 day SMA | 3.94 | 3.94 | 3.93 | | 200 day SMA | 3.53 | 3.53 | 3.53 |
|
|
