SchneiderNational SNDR full analysis,charts,indicators,moving averages,SMA,DMA,EMA,ADX,MACD,RSISchneider National SNDR WideScreen charts, DMA,SMA,EMA technical analysis, forecast prediction, by indicators ADX,MACD,RSI,CCI USA stock exchange
operates under Transportation sector & deals in Trucking Freight Courier Services
Daily price and charts and targets SchneiderNational Strong Daily Stock price targets for SchneiderNational SNDR are 23.45 and 23.85 | Daily Target 1 | 23.13 | | Daily Target 2 | 23.36 | | Daily Target 3 | 23.533333333333 | | Daily Target 4 | 23.76 | | Daily Target 5 | 23.93 |
Daily price and volume Schneider National
| Date |
Closing |
Open |
Range |
Volume |
Mon 20 October 2025 |
23.58 (1.55%) |
23.31 |
23.31 - 23.71 |
0.568 times |
Fri 17 October 2025 |
23.22 (-1.65%) |
23.65 |
23.00 - 23.71 |
0.8176 times |
Thu 16 October 2025 |
23.61 (4.1%) |
23.56 |
23.27 - 23.97 |
1.3179 times |
Wed 15 October 2025 |
22.68 (0.84%) |
22.58 |
22.41 - 22.85 |
0.8326 times |
Tue 14 October 2025 |
22.49 (1.63%) |
21.94 |
21.87 - 22.57 |
0.8721 times |
Mon 13 October 2025 |
22.13 (2.41%) |
22.23 |
21.91 - 22.44 |
0.9896 times |
Tue 07 October 2025 |
21.61 (-1.95%) |
21.94 |
21.35 - 22.21 |
1.2181 times |
Mon 06 October 2025 |
22.04 (1.43%) |
21.98 |
21.54 - 22.32 |
1.0449 times |
Fri 03 October 2025 |
21.73 (3.08%) |
21.59 |
21.45 - 22.09 |
1.5091 times |
Thu 02 October 2025 |
21.08 (1.15%) |
20.89 |
20.75 - 21.08 |
0.83 times |
Wed 01 October 2025 |
20.84 (-1.51%) |
20.99 |
20.73 - 21.17 |
0.8568 times |
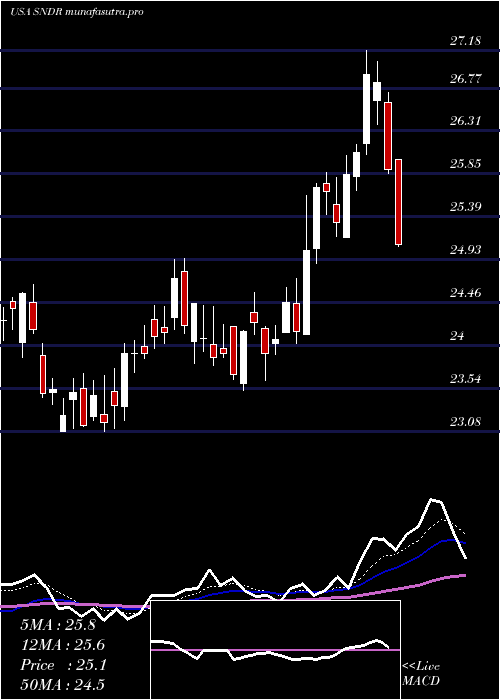
Weekly price and charts SchneiderNational Strong weekly Stock price targets for SchneiderNational SNDR are 23.45 and 23.85 | Weekly Target 1 | 23.13 | | Weekly Target 2 | 23.36 | | Weekly Target 3 | 23.533333333333 | | Weekly Target 4 | 23.76 | | Weekly Target 5 | 23.93 |
Weekly price and volumes for Schneider National
| Date |
Closing |
Open |
Range |
Volume |
Mon 20 October 2025 |
23.58 (1.55%) |
23.31 |
23.31 - 23.71 |
0.1693 times |
Fri 17 October 2025 |
23.22 (7.45%) |
22.23 |
21.87 - 23.97 |
1.4397 times |
Tue 07 October 2025 |
21.61 (-0.55%) |
21.98 |
21.35 - 22.32 |
0.6746 times |
Fri 03 October 2025 |
21.73 (2.21%) |
21.36 |
20.70 - 22.09 |
1.699 times |
Fri 26 September 2025 |
21.26 (-5.13%) |
22.40 |
21.06 - 22.40 |
1.6479 times |
Fri 19 September 2025 |
22.41 (-5.96%) |
23.97 |
22.38 - 24.39 |
1.4052 times |
Fri 12 September 2025 |
23.83 (-2.93%) |
24.64 |
23.64 - 24.66 |
0.7163 times |
Fri 05 September 2025 |
24.55 (-0.69%) |
24.43 |
24.01 - 25.16 |
0.5675 times |
Fri 29 August 2025 |
24.72 (0%) |
24.69 |
24.49 - 24.84 |
0.1822 times |
Fri 29 August 2025 |
24.72 (-2.45%) |
25.23 |
24.26 - 25.26 |
1.4984 times |
Fri 22 August 2025 |
25.34 (3.64%) |
24.52 |
23.94 - 25.75 |
0.8611 times |
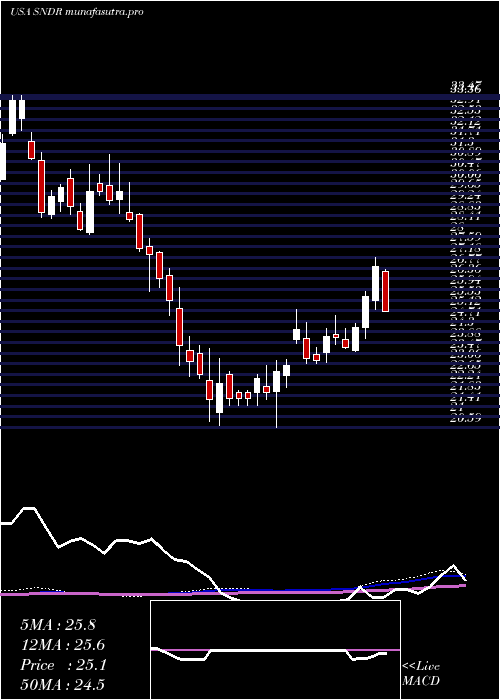
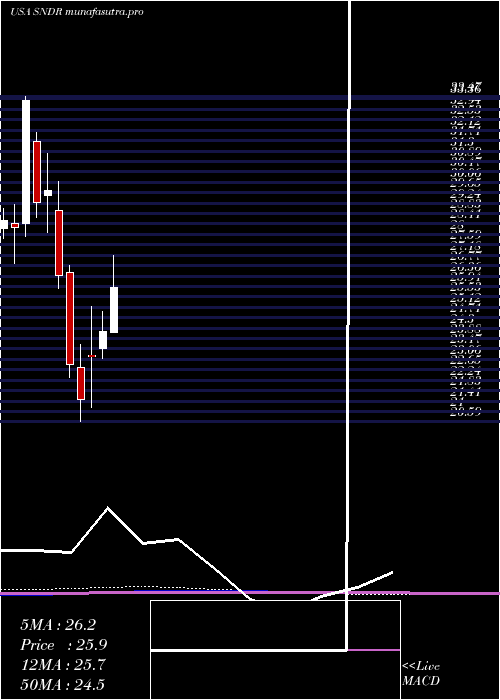
Monthly price and charts SchneiderNational Strong monthly Stock price targets for SchneiderNational SNDR are 22.16 and 25.4 | Monthly Target 1 | 19.52 | | Monthly Target 2 | 21.55 | | Monthly Target 3 | 22.76 | | Monthly Target 4 | 24.79 | | Monthly Target 5 | 26 |
Monthly price and volumes Schneider National
| Date |
Closing |
Open |
Range |
Volume |
Mon 20 October 2025 |
23.58 (11.44%) |
20.99 |
20.73 - 23.97 |
0.7423 times |
Tue 30 September 2025 |
21.16 (-14.4%) |
24.43 |
20.70 - 25.16 |
1.166 times |
Fri 29 August 2025 |
24.72 (1.1%) |
24.45 |
23.44 - 25.75 |
1.0025 times |
Thu 31 July 2025 |
24.45 (1.24%) |
24.12 |
24.02 - 27.18 |
1.0801 times |
Mon 30 June 2025 |
24.15 (4.23%) |
23.51 |
23.11 - 24.94 |
0.8695 times |
Fri 30 May 2025 |
23.17 (7.82%) |
23.20 |
21.15 - 25.17 |
1.0196 times |
Wed 30 April 2025 |
21.49 (-5.95%) |
22.73 |
20.59 - 23.66 |
0.9939 times |
Mon 31 March 2025 |
22.85 (-13.38%) |
26.49 |
22.36 - 26.77 |
1.0219 times |
Fri 28 February 2025 |
26.38 (-11.33%) |
28.94 |
25.88 - 30.09 |
0.8395 times |
Fri 31 January 2025 |
29.75 (1.61%) |
29.56 |
28.06 - 31.19 |
1.2647 times |
Tue 31 December 2024 |
29.28 (-12.02%) |
31.69 |
28.68 - 32.03 |
0.6761 times |
DMA SMA EMA moving averages of Schneider National SNDR
DMA (daily moving average) of Schneider National SNDR
| DMA period | DMA value | | 5 day DMA | 23.12 | | 12 day DMA | 22.18 | | 20 day DMA | 22.04 | | 35 day DMA | 23.01 | | 50 day DMA | 23.48 | | 100 day DMA | 24.08 | | 150 day DMA | 23.67 | | 200 day DMA | 24.83 | EMA (exponential moving average) of Schneider National SNDR
| EMA period | EMA current | EMA prev | EMA prev2 | | 5 day EMA | 23.11 | 22.87 | 22.69 | | 12 day EMA | 22.61 | 22.43 | 22.29 | | 20 day EMA | 22.59 | 22.49 | 22.41 | | 35 day EMA | 22.91 | 22.87 | 22.85 | | 50 day EMA | 23.54 | 23.54 | 23.55 |
SMA (simple moving average) of Schneider National SNDR
| SMA period | SMA current | SMA prev | SMA prev2 | | 5 day SMA | 23.12 | 22.83 | 22.5 | | 12 day SMA | 22.18 | 21.97 | 21.81 | | 20 day SMA | 22.04 | 22.02 | 22.07 | | 35 day SMA | 23.01 | 23.05 | 23.1 | | 50 day SMA | 23.48 | 23.51 | 23.54 | | 100 day SMA | 24.08 | 24.08 | 24.09 | | 150 day SMA | 23.67 | 23.67 | 23.69 | | 200 day SMA | 24.83 | 24.86 | 24.89 |
|
|
