SnapInc SNAP full analysis,charts,indicators,moving averages,SMA,DMA,EMA,ADX,MACD,RSISnap Inc SNAP WideScreen charts, DMA,SMA,EMA technical analysis, forecast prediction, by indicators ADX,MACD,RSI,CCI USA stock exchange
operates under Technology sector & deals in Computer Software Programming Data Processing
Daily price and charts and targets SnapInc Strong Daily Stock price targets for SnapInc SNAP are 7.8 and 8.11 | Daily Target 1 | 7.56 | | Daily Target 2 | 7.73 | | Daily Target 3 | 7.8666666666667 | | Daily Target 4 | 8.04 | | Daily Target 5 | 8.18 |
Daily price and volume Snap Inc
| Date |
Closing |
Open |
Range |
Volume |
Fri 05 December 2025 |
7.91 (1.67%) |
7.79 |
7.69 - 8.00 |
0.906 times |
Thu 04 December 2025 |
7.78 (1.57%) |
7.67 |
7.64 - 7.84 |
0.8755 times |
Wed 03 December 2025 |
7.66 (0.52%) |
7.62 |
7.55 - 7.70 |
0.8208 times |
Tue 02 December 2025 |
7.62 (-0.26%) |
7.66 |
7.53 - 7.69 |
0.7664 times |
Mon 01 December 2025 |
7.64 (-0.52%) |
7.58 |
7.49 - 7.70 |
1.4862 times |
Fri 28 November 2025 |
7.68 (0.92%) |
7.65 |
7.57 - 7.69 |
1.2941 times |
Wed 26 November 2025 |
7.61 (-0.39%) |
7.67 |
7.59 - 7.74 |
0.76 times |
Tue 25 November 2025 |
7.64 (-0.52%) |
7.69 |
7.59 - 7.76 |
0.821 times |
Mon 24 November 2025 |
7.68 (-0.13%) |
7.74 |
7.62 - 7.82 |
0.9523 times |
Fri 21 November 2025 |
7.69 (-1.16%) |
7.94 |
7.56 - 7.94 |
1.3179 times |
Thu 20 November 2025 |
7.78 (-3.11%) |
8.23 |
7.76 - 8.30 |
1.5542 times |
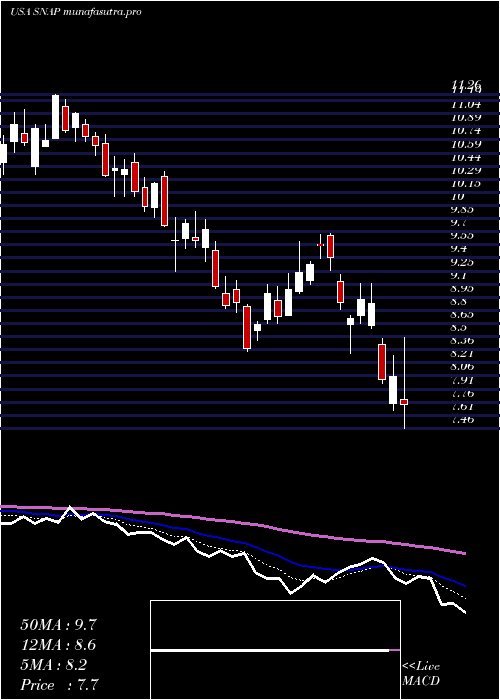
Weekly price and charts SnapInc Strong weekly Stock price targets for SnapInc SNAP are 7.7 and 8.21 | Weekly Target 1 | 7.29 | | Weekly Target 2 | 7.6 | | Weekly Target 3 | 7.8 | | Weekly Target 4 | 8.11 | | Weekly Target 5 | 8.31 |
Weekly price and volumes for Snap Inc
| Date |
Closing |
Open |
Range |
Volume |
Fri 05 December 2025 |
7.91 (2.99%) |
7.58 |
7.49 - 8.00 |
0.776 times |
Fri 28 November 2025 |
7.68 (-0.13%) |
7.74 |
7.57 - 7.82 |
0.6118 times |
Fri 21 November 2025 |
7.69 (-10.27%) |
8.57 |
7.56 - 8.62 |
1.1495 times |
Fri 14 November 2025 |
8.57 (4.38%) |
8.32 |
8.23 - 9.13 |
1.4408 times |
Fri 07 November 2025 |
8.21 (5.26%) |
7.76 |
7.22 - 8.63 |
1.6484 times |
Fri 31 October 2025 |
7.80 (0%) |
7.68 |
7.63 - 7.82 |
0.2321 times |
Fri 31 October 2025 |
7.80 (-1.89%) |
8.07 |
7.48 - 8.07 |
1.0391 times |
Fri 24 October 2025 |
7.95 (3.92%) |
7.73 |
7.61 - 8.03 |
0.8091 times |
Fri 17 October 2025 |
7.65 (-5.9%) |
8.03 |
7.63 - 8.10 |
1.0925 times |
Tue 07 October 2025 |
8.13 (-5.13%) |
8.63 |
8.11 - 8.88 |
1.2008 times |
Fri 03 October 2025 |
8.57 (3.63%) |
8.32 |
7.52 - 8.74 |
4.7541 times |
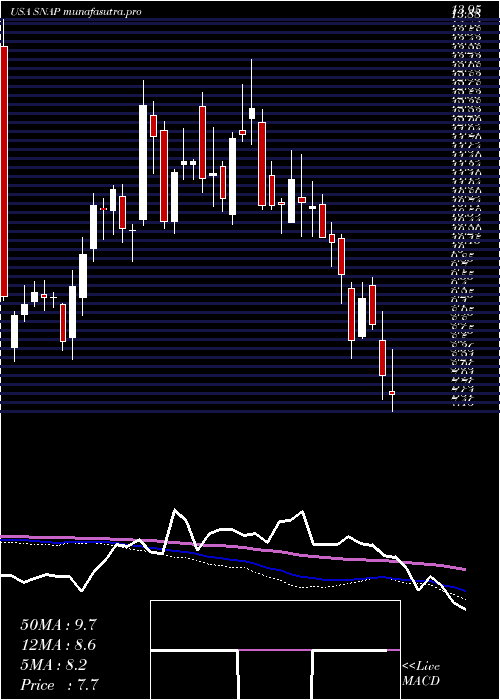
Monthly price and charts SnapInc Strong monthly Stock price targets for SnapInc SNAP are 7.7 and 8.21 | Monthly Target 1 | 7.29 | | Monthly Target 2 | 7.6 | | Monthly Target 3 | 7.8 | | Monthly Target 4 | 8.11 | | Monthly Target 5 | 8.31 |
Monthly price and volumes Snap Inc
| Date |
Closing |
Open |
Range |
Volume |
Fri 05 December 2025 |
7.91 (2.99%) |
7.58 |
7.49 - 8.00 |
0.1451 times |
Fri 28 November 2025 |
7.68 (-1.54%) |
7.76 |
7.22 - 9.13 |
0.907 times |
Fri 31 October 2025 |
7.80 (1.17%) |
7.54 |
7.48 - 8.88 |
1.2717 times |
Tue 30 September 2025 |
7.71 (7.98%) |
7.01 |
6.90 - 9.28 |
2.9261 times |
Fri 29 August 2025 |
7.14 (-24.28%) |
9.15 |
6.98 - 9.55 |
1.2256 times |
Thu 31 July 2025 |
9.43 (8.52%) |
9.00 |
8.91 - 10.41 |
0.8128 times |
Mon 30 June 2025 |
8.69 (5.33%) |
8.18 |
7.75 - 8.95 |
0.6064 times |
Fri 30 May 2025 |
8.25 (3.64%) |
8.01 |
7.80 - 9.26 |
0.7044 times |
Wed 30 April 2025 |
7.96 (-8.61%) |
8.74 |
7.08 - 9.23 |
0.8852 times |
Mon 31 March 2025 |
8.71 (-15.02%) |
10.32 |
8.31 - 10.38 |
0.5157 times |
Fri 28 February 2025 |
10.25 (-9.21%) |
11.00 |
9.86 - 11.71 |
0.5622 times |
DMA SMA EMA moving averages of Snap Inc SNAP
DMA (daily moving average) of Snap Inc SNAP
| DMA period | DMA value | | 5 day DMA | 7.72 | | 12 day DMA | 7.73 | | 20 day DMA | 8.05 | | 35 day DMA | 7.92 | | 50 day DMA | 7.99 | | 100 day DMA | 8.05 | | 150 day DMA | 8.21 | | 200 day DMA | 8.38 | EMA (exponential moving average) of Snap Inc SNAP
| EMA period | EMA current | EMA prev | EMA prev2 | | 5 day EMA | 7.78 | 7.71 | 7.67 | | 12 day EMA | 7.81 | 7.79 | 7.79 | | 20 day EMA | 7.88 | 7.88 | 7.89 | | 35 day EMA | 7.95 | 7.95 | 7.96 | | 50 day EMA | 7.97 | 7.97 | 7.98 |
SMA (simple moving average) of Snap Inc SNAP
| SMA period | SMA current | SMA prev | SMA prev2 | | 5 day SMA | 7.72 | 7.68 | 7.64 | | 12 day SMA | 7.73 | 7.76 | 7.79 | | 20 day SMA | 8.05 | 8.06 | 8.04 | | 35 day SMA | 7.92 | 7.92 | 7.92 | | 50 day SMA | 7.99 | 8 | 8.01 | | 100 day SMA | 8.05 | 8.06 | 8.07 | | 150 day SMA | 8.21 | 8.21 | 8.22 | | 200 day SMA | 8.38 | 8.4 | 8.41 |
|
|
