SemtechCorporation SMTC full analysis,charts,indicators,moving averages,SMA,DMA,EMA,ADX,MACD,RSISemtech Corporation SMTC WideScreen charts, DMA,SMA,EMA technical analysis, forecast prediction, by indicators ADX,MACD,RSI,CCI USA stock exchange
operates under Technology sector & deals in Semiconductors
Daily price and charts and targets SemtechCorporation Strong Daily Stock price targets for SemtechCorporation SMTC are 66.41 and 69.09 | Daily Target 1 | 65.95 | | Daily Target 2 | 66.86 | | Daily Target 3 | 68.626666666667 | | Daily Target 4 | 69.54 | | Daily Target 5 | 71.31 |
Daily price and volume Semtech Corporation
| Date |
Closing |
Open |
Range |
Volume |
Fri 17 October 2025 |
67.78 (-1.54%) |
69.15 |
67.71 - 70.39 |
0.4947 times |
Thu 16 October 2025 |
68.84 (-1.36%) |
69.03 |
68.84 - 71.30 |
0.3637 times |
Wed 15 October 2025 |
69.79 (3.19%) |
69.24 |
68.26 - 70.13 |
0.6008 times |
Tue 14 October 2025 |
67.63 (-0.94%) |
65.53 |
65.53 - 69.31 |
0.5511 times |
Mon 13 October 2025 |
68.27 (4.61%) |
68.03 |
66.97 - 69.12 |
1.0548 times |
Fri 10 October 2025 |
65.26 (-6.82%) |
70.51 |
65.15 - 70.99 |
1.1825 times |
Thu 09 October 2025 |
70.04 (-0.71%) |
70.00 |
68.57 - 70.52 |
0.6488 times |
Wed 08 October 2025 |
70.54 (-0.52%) |
70.80 |
69.04 - 70.91 |
1.879 times |
Tue 07 October 2025 |
70.91 (2.6%) |
71.30 |
70.31 - 73.95 |
2.5121 times |
Mon 06 October 2025 |
69.11 (-2.91%) |
72.52 |
65.06 - 73.22 |
0.7126 times |
Fri 03 October 2025 |
71.18 (-2.4%) |
72.82 |
71.10 - 74.25 |
0.5863 times |
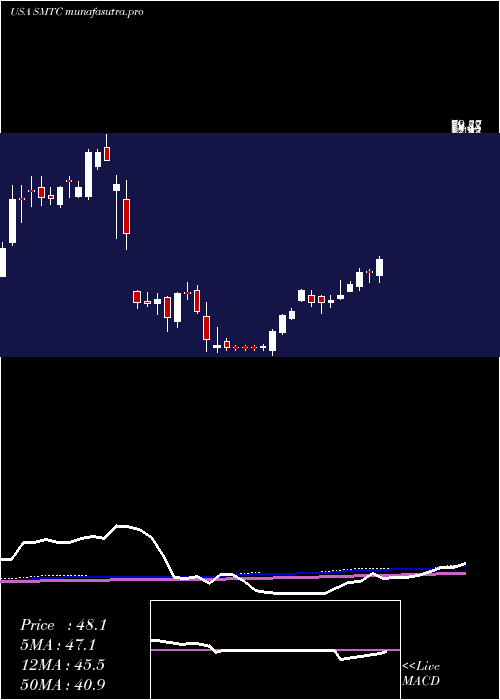
Weekly price and charts SemtechCorporation Strong weekly Stock price targets for SemtechCorporation SMTC are 63.77 and 69.54 | Weekly Target 1 | 62.43 | | Weekly Target 2 | 65.11 | | Weekly Target 3 | 68.203333333333 | | Weekly Target 4 | 70.88 | | Weekly Target 5 | 73.97 |
Weekly price and volumes for Semtech Corporation
| Date |
Closing |
Open |
Range |
Volume |
Fri 17 October 2025 |
67.78 (3.86%) |
68.03 |
65.53 - 71.30 |
0.6491 times |
Fri 10 October 2025 |
65.26 (-8.32%) |
72.52 |
65.06 - 73.95 |
1.4687 times |
Fri 03 October 2025 |
71.18 (13.04%) |
63.69 |
61.72 - 74.25 |
1.2427 times |
Fri 26 September 2025 |
62.97 (3.45%) |
61.20 |
57.50 - 63.23 |
0.616 times |
Fri 19 September 2025 |
60.87 (0.95%) |
60.30 |
59.50 - 63.49 |
1.1748 times |
Fri 12 September 2025 |
60.30 (-0.61%) |
61.03 |
59.77 - 63.40 |
0.8156 times |
Fri 05 September 2025 |
60.67 (4.44%) |
55.99 |
55.18 - 61.55 |
0.7217 times |
Fri 29 August 2025 |
58.09 (0%) |
60.00 |
57.61 - 60.17 |
0.1925 times |
Fri 29 August 2025 |
58.09 (13.7%) |
51.02 |
50.42 - 61.40 |
2.202 times |
Fri 22 August 2025 |
51.09 (2.53%) |
49.75 |
46.02 - 52.45 |
0.9169 times |
Fri 15 August 2025 |
49.83 (-2.01%) |
50.70 |
47.86 - 53.52 |
1.0247 times |
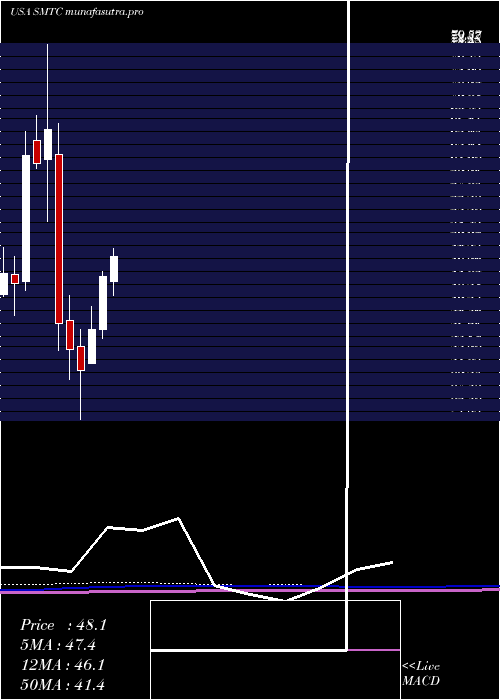
Monthly price and charts SemtechCorporation Strong monthly Stock price targets for SemtechCorporation SMTC are 61.83 and 71.02 | Monthly Target 1 | 59.84 | | Monthly Target 2 | 63.81 | | Monthly Target 3 | 69.03 | | Monthly Target 4 | 73 | | Monthly Target 5 | 78.22 |
Monthly price and volumes Semtech Corporation
| Date |
Closing |
Open |
Range |
Volume |
Fri 17 October 2025 |
67.78 (-5.14%) |
70.00 |
65.06 - 74.25 |
0.502 times |
Tue 30 September 2025 |
71.45 (23%) |
55.99 |
55.18 - 71.71 |
0.7359 times |
Fri 29 August 2025 |
58.09 (13.68%) |
48.91 |
46.02 - 61.40 |
0.9765 times |
Thu 31 July 2025 |
51.10 (13.2%) |
44.44 |
42.38 - 55.80 |
0.9314 times |
Mon 30 June 2025 |
45.14 (20.92%) |
37.31 |
36.10 - 45.98 |
0.9059 times |
Fri 30 May 2025 |
37.33 (19.46%) |
32.37 |
32.30 - 40.69 |
1.0274 times |
Wed 30 April 2025 |
31.25 (-9.16%) |
34.79 |
24.05 - 37.36 |
1.1617 times |
Mon 31 March 2025 |
34.40 (-9.92%) |
38.71 |
29.98 - 42.34 |
1.2139 times |
Fri 28 February 2025 |
38.19 (-42.97%) |
63.24 |
34.25 - 67.85 |
1.5475 times |
Fri 31 January 2025 |
66.96 (8.26%) |
62.53 |
53.25 - 79.52 |
0.9979 times |
Tue 31 December 2024 |
61.85 (-2%) |
65.30 |
61.14 - 68.96 |
0.57 times |
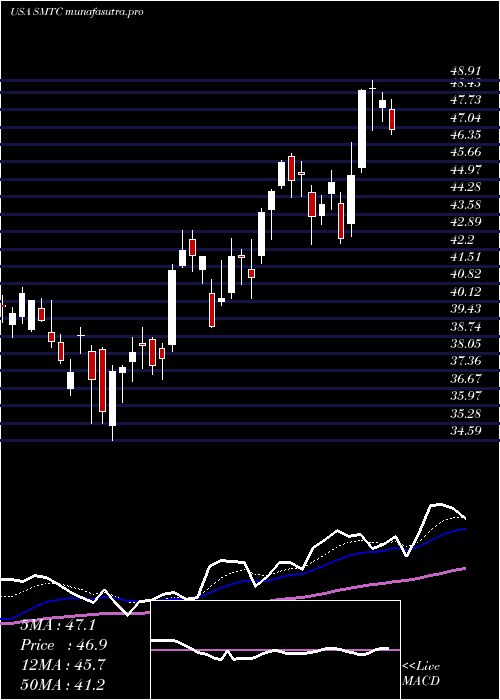
DMA SMA EMA moving averages of Semtech Corporation SMTC
DMA (daily moving average) of Semtech Corporation SMTC
| DMA period | DMA value | | 5 day DMA | 68.46 | | 12 day DMA | 69.36 | | 20 day DMA | 67.23 | | 35 day DMA | 64.39 | | 50 day DMA | 60.86 | | 100 day DMA | 53.18 | | 150 day DMA | 46.51 | | 200 day DMA | 48.07 | EMA (exponential moving average) of Semtech Corporation SMTC
| EMA period | EMA current | EMA prev | EMA prev2 | | 5 day EMA | 68.43 | 68.75 | 68.7 | | 12 day EMA | 68.16 | 68.23 | 68.12 | | 20 day EMA | 66.97 | 66.89 | 66.68 | | 35 day EMA | 64.04 | 63.82 | 63.52 | | 50 day EMA | 60.79 | 60.51 | 60.17 |
SMA (simple moving average) of Semtech Corporation SMTC
| SMA period | SMA current | SMA prev | SMA prev2 | | 5 day SMA | 68.46 | 67.96 | 68.2 | | 12 day SMA | 69.36 | 69.68 | 69.9 | | 20 day SMA | 67.23 | 66.89 | 66.5 | | 35 day SMA | 64.39 | 64.11 | 63.87 | | 50 day SMA | 60.86 | 60.52 | 60.17 | | 100 day SMA | 53.18 | 52.88 | 52.57 | | 150 day SMA | 46.51 | 46.27 | 46.04 | | 200 day SMA | 48.07 | 48.04 | 48 |
|
|
