SmithMicro SMSI full analysis,charts,indicators,moving averages,SMA,DMA,EMA,ADX,MACD,RSISmith Micro SMSI WideScreen charts, DMA,SMA,EMA technical analysis, forecast prediction, by indicators ADX,MACD,RSI,CCI USA stock exchange
operates under Technology sector & deals in Computer Software Prepackaged Software
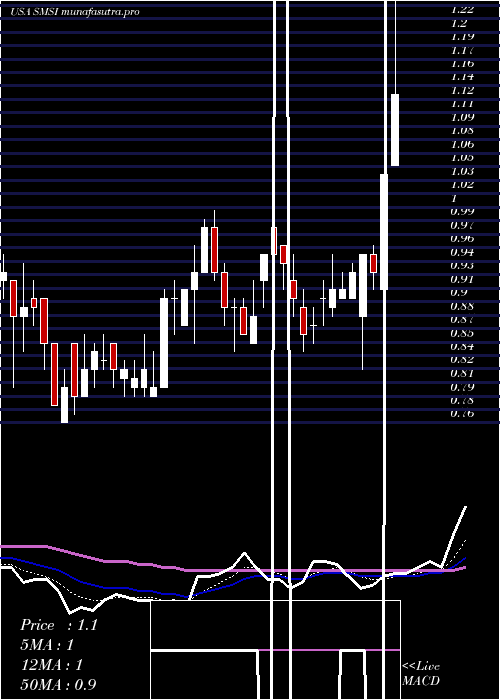
Daily price and charts and targets SmithMicro Strong Daily Stock price targets for SmithMicro SMSI are 0.68 and 0.73 | Daily Target 1 | 0.67 | | Daily Target 2 | 0.69 | | Daily Target 3 | 0.72 | | Daily Target 4 | 0.74 | | Daily Target 5 | 0.77 |
Daily price and volume Smith Micro
| Date |
Closing |
Open |
Range |
Volume |
Mon 20 October 2025 |
0.71 (0%) |
0.72 |
0.70 - 0.75 |
0.1101 times |
Fri 17 October 2025 |
0.71 (1.43%) |
0.70 |
0.68 - 0.74 |
0.1625 times |
Thu 16 October 2025 |
0.70 (-13.58%) |
0.80 |
0.68 - 0.85 |
0.7294 times |
Wed 15 October 2025 |
0.81 (0%) |
0.81 |
0.79 - 0.85 |
8.3073 times |
Tue 14 October 2025 |
0.81 (1.25%) |
0.79 |
0.77 - 0.81 |
0.0362 times |
Mon 13 October 2025 |
0.80 (2.56%) |
0.79 |
0.78 - 0.83 |
0.0925 times |
Fri 10 October 2025 |
0.78 (-7.14%) |
0.85 |
0.77 - 0.88 |
0.0762 times |
Thu 09 October 2025 |
0.84 (-6.67%) |
0.89 |
0.82 - 0.91 |
0.1049 times |
Wed 08 October 2025 |
0.90 (16.88%) |
0.87 |
0.82 - 0.91 |
0.3206 times |
Tue 07 October 2025 |
0.77 (-6.1%) |
0.80 |
0.77 - 0.82 |
0.0603 times |
Mon 06 October 2025 |
0.82 (5.13%) |
0.78 |
0.76 - 0.82 |
0.1388 times |
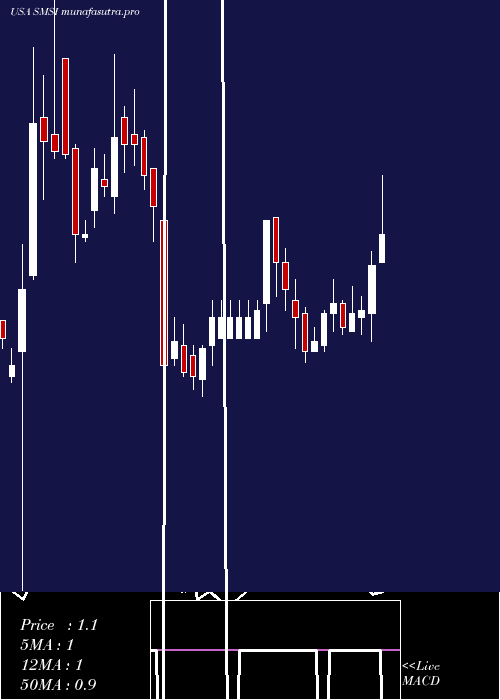
Weekly price and charts SmithMicro Strong weekly Stock price targets for SmithMicro SMSI are 0.68 and 0.73 | Weekly Target 1 | 0.67 | | Weekly Target 2 | 0.69 | | Weekly Target 3 | 0.72 | | Weekly Target 4 | 0.74 | | Weekly Target 5 | 0.77 |
Weekly price and volumes for Smith Micro
| Date |
Closing |
Open |
Range |
Volume |
Mon 20 October 2025 |
0.71 (0%) |
0.72 |
0.70 - 0.75 |
0.0911 times |
Fri 17 October 2025 |
0.71 (-8.97%) |
0.79 |
0.68 - 0.85 |
7.7214 times |
Fri 10 October 2025 |
0.78 (0%) |
0.78 |
0.76 - 0.91 |
0.5802 times |
Fri 03 October 2025 |
0.78 (6.85%) |
0.74 |
0.71 - 0.80 |
0.3055 times |
Fri 26 September 2025 |
0.73 (-9.88%) |
0.81 |
0.71 - 0.82 |
0.2827 times |
Fri 19 September 2025 |
0.81 (15.71%) |
0.69 |
0.69 - 0.83 |
0.4042 times |
Fri 12 September 2025 |
0.70 (-5.41%) |
0.72 |
0.69 - 0.77 |
0.2625 times |
Fri 05 September 2025 |
0.74 (0%) |
0.74 |
0.71 - 0.75 |
0.1013 times |
Fri 29 August 2025 |
0.74 (0%) |
0.75 |
0.73 - 0.76 |
0.0316 times |
Fri 29 August 2025 |
0.74 (5.71%) |
0.71 |
0.67 - 0.77 |
0.2195 times |
Fri 22 August 2025 |
0.70 (0%) |
0.71 |
0.65 - 0.72 |
0.1571 times |
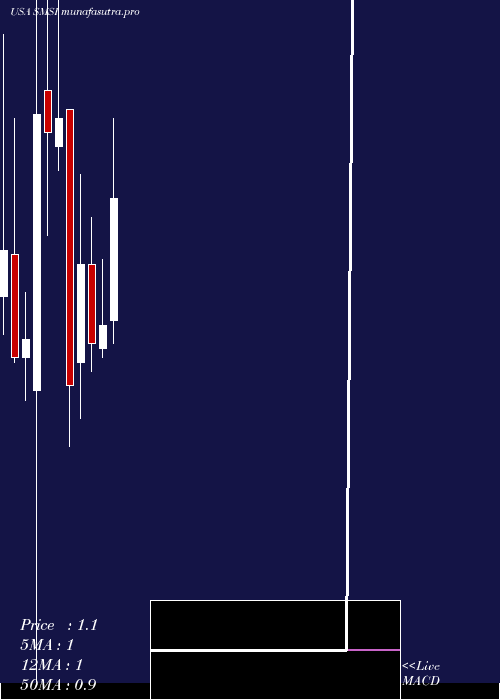
Monthly price and charts SmithMicro Strong monthly Stock price targets for SmithMicro SMSI are 0.58 and 0.81 | Monthly Target 1 | 0.54 | | Monthly Target 2 | 0.62 | | Monthly Target 3 | 0.76666666666667 | | Monthly Target 4 | 0.85 | | Monthly Target 5 | 1 |
Monthly price and volumes Smith Micro
| Date |
Closing |
Open |
Range |
Volume |
Mon 20 October 2025 |
0.71 (-1.39%) |
0.72 |
0.68 - 0.91 |
3.6062 times |
Tue 30 September 2025 |
0.72 (-2.7%) |
0.74 |
0.69 - 0.83 |
0.4677 times |
Fri 29 August 2025 |
0.74 (8.82%) |
0.69 |
0.64 - 0.84 |
0.6342 times |
Thu 31 July 2025 |
0.68 (-20.93%) |
0.87 |
0.66 - 1.30 |
1.4349 times |
Mon 30 June 2025 |
0.86 (4.88%) |
0.81 |
0.79 - 1.00 |
0.2967 times |
Fri 30 May 2025 |
0.82 (-17.17%) |
0.99 |
0.76 - 1.09 |
0.4127 times |
Wed 30 April 2025 |
0.99 (35.62%) |
0.78 |
0.66 - 1.18 |
0.382 times |
Mon 31 March 2025 |
0.73 (-43.85%) |
1.32 |
0.60 - 1.32 |
0.8565 times |
Fri 28 February 2025 |
1.30 (2.36%) |
1.24 |
1.19 - 1.65 |
0.5773 times |
Fri 31 January 2025 |
1.27 (-3.05%) |
1.36 |
1.05 - 1.95 |
1.3317 times |
Tue 31 December 2024 |
1.31 (57.83%) |
0.72 |
0.10 - 1.67 |
1.4005 times |
DMA SMA EMA moving averages of Smith Micro SMSI
DMA (daily moving average) of Smith Micro SMSI
| DMA period | DMA value | | 5 day DMA | 0.75 | | 12 day DMA | 0.79 | | 20 day DMA | 0.77 | | 35 day DMA | 0.75 | | 50 day DMA | 0.74 | | 100 day DMA | 0.8 | | 150 day DMA | 0.83 | | 200 day DMA | 0.94 | EMA (exponential moving average) of Smith Micro SMSI
| EMA period | EMA current | EMA prev | EMA prev2 | | 5 day EMA | 0.74 | 0.75 | 0.77 | | 12 day EMA | 0.76 | 0.77 | 0.78 | | 20 day EMA | 0.76 | 0.76 | 0.76 | | 35 day EMA | 0.75 | 0.75 | 0.75 | | 50 day EMA | 0.73 | 0.73 | 0.73 |
SMA (simple moving average) of Smith Micro SMSI
| SMA period | SMA current | SMA prev | SMA prev2 | | 5 day SMA | 0.75 | 0.77 | 0.78 | | 12 day SMA | 0.79 | 0.79 | 0.79 | | 20 day SMA | 0.77 | 0.77 | 0.77 | | 35 day SMA | 0.75 | 0.75 | 0.75 | | 50 day SMA | 0.74 | 0.74 | 0.74 | | 100 day SMA | 0.8 | 0.8 | 0.8 | | 150 day SMA | 0.83 | 0.83 | 0.83 | | 200 day SMA | 0.94 | 0.94 | 0.95 |
|
|
